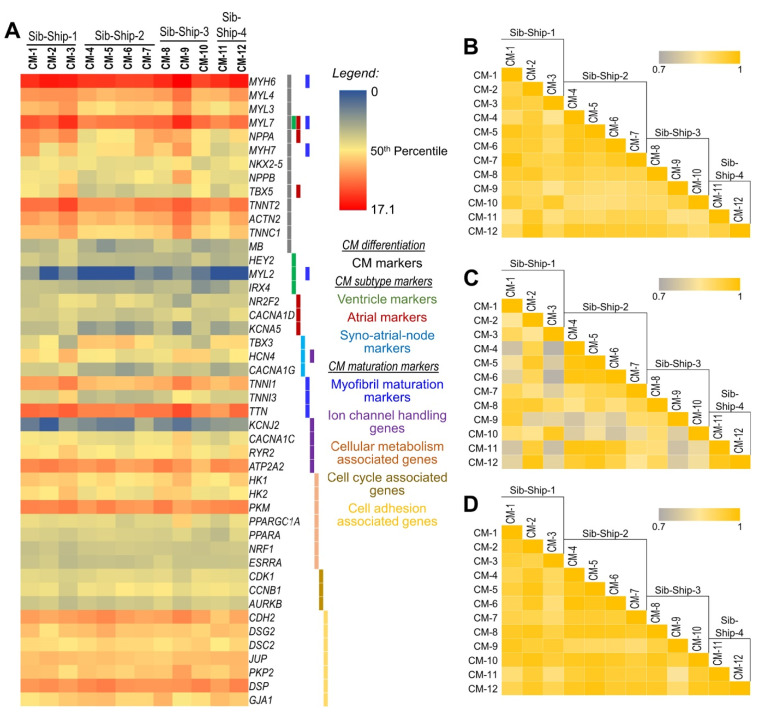
Figure 2.
Expression analysis of CM-specific, CM-subtype-specific, and CM maturity-associated genes to assess uniform CM population across 12 CM samples. (A) Heat map showing normalized (log2) expression of CM-specific, CM-subtype-specific, and CM maturity-associated genes in 12 iPSC-generated CM lines. (B–D) Correlation coefficient (r2) plots based on (B) CM-specific, (C) CM-subtype-specific, and (D) CM maturity-associated genes in 12 iPSC-generated CM lines, respectively.

