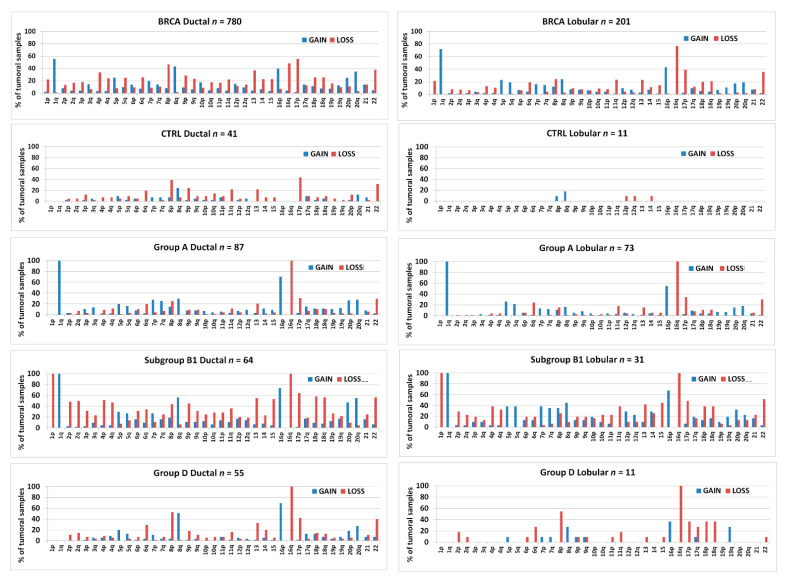
Figure 14.
Bar graphs showing the percentage of samples bearing arm-level gains or losses in chromosomes 1–22 in invasive ductal or lobular breast carcinomas or in the different 1,16-chromogroups formed with invasive ductal carcinomas or invasive lobular carcinomas, as indicated in each graphs. The number of samples (n) in each chromogroup is reported in the corresponding graph.

