Figure 3.
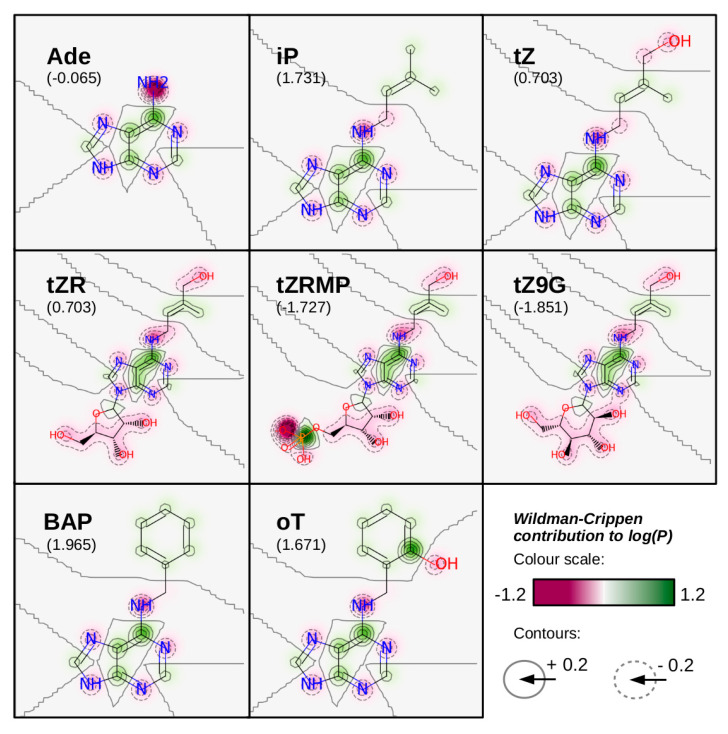
For selected CKs, Wildman-Crippen contributions of individual atoms to the value of log(P) have been predicted according to [54]. Gaussian distribution of the contributions have been visualized and juxtaposed with the corresponding molecular structures. Negative contributions (which decrease the overall hydrophobicity of the molecule) are depicted in shades of pink, while positive contributions (which increase the overall hydrophobicity) are depicted in shades of green (refer to the colour-bar in the bottom right corner of the figure). Increments of Wildman-Crippen contribution levels are also expressed by solid (above zero levels) and dashed contours (below zero levels). For each molecule, the Wildman-Crippen value of log(P) is given in the parentheses. Note that contributions of hydrogen atoms, which have been included in predicting total log(P) values, are not shown. Calculation and visualization of the Wildman-Crippen contributions have been performed using RDKit: Open-source cheminformatics software (http://www.rdkit.org, accessed on 4 January 2021). Ade: adenine; iP: isopentenyl adenine; tZ: trans-zeatin; tZR: trans-zeatin riboside; tZRMP: trans-zeatin riboside monophosphate; tZ9G: trans-zeatin N9-glucoside; BAP: 6-benzylaminopurine; oT: ortho-topolin; P—octanol-water partition coefficient.

