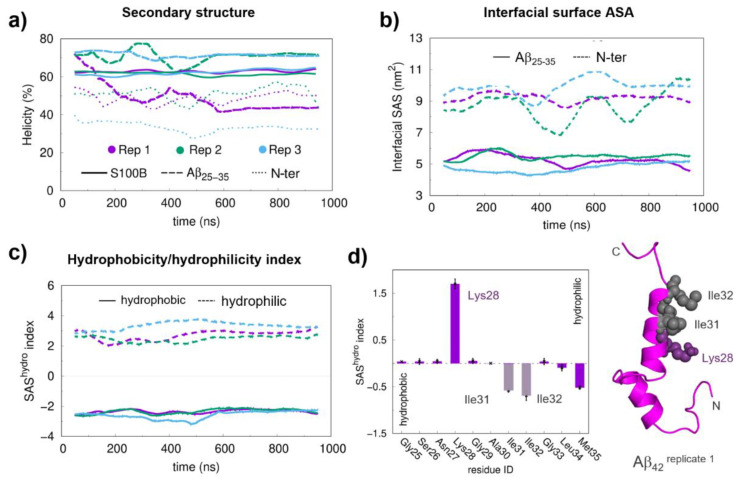
Figure 2.
Structural equilibration properties, the hydrophobicity/hydrophilicity (SAShydro) index, and the final conformations for the long molecular docking (MD) simulations. (a) Helical content of S100B, Aβ25–35 and AβN-ter during production MD runs. (b) Interfacial area between Aβ25–35/AβN-ter and S100B. (c) SAShydro indexes for the Aβ25–35 region at the interface. (d) Average SAShydro index values for the hydrophobic and hydrophilic residues in the Aβ25–35 segment. A floating window of 100 ns was used in the time series to reduce the local fluctuations. The final interfacial Solvent Acessible Surface Area (SASA) values were obtained by averaging the two interfacial areas, one mapped on the protein and another mapped on the peptide surface. The hydrophobic and hydrophilic residues in the SAShydro index calculations were separated based on their sign (positive for hydrophilic and negative for hydrophobic residues). The average SAShydro index values were obtained from the equilibrated segments (the last 450 ns). The error bars were calculated from the standard error of the mean between replicates. A representative structure of the Aβ42 peptide is shown in the cartoon with the most relevant residues, in terms of SAShydro index values, represented with spheres.

