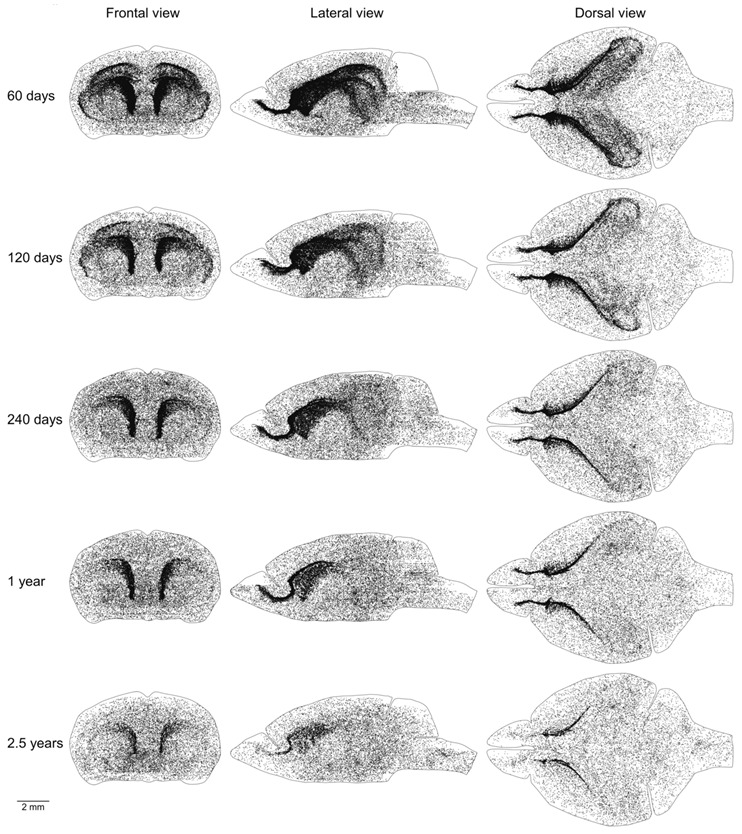
Figure 2.

Distribution of proliferating cells in the mouse brain. Each 5-Ethynyl-2′-deoxyuridine (EdU)-labeled nucleus is shown as a black dot. The scale is shown at the bottom. The brain shape is outlined with a black line. Frontal, lateral, and dorsal views of the brain are shown. Mouse age is shown on the left.
