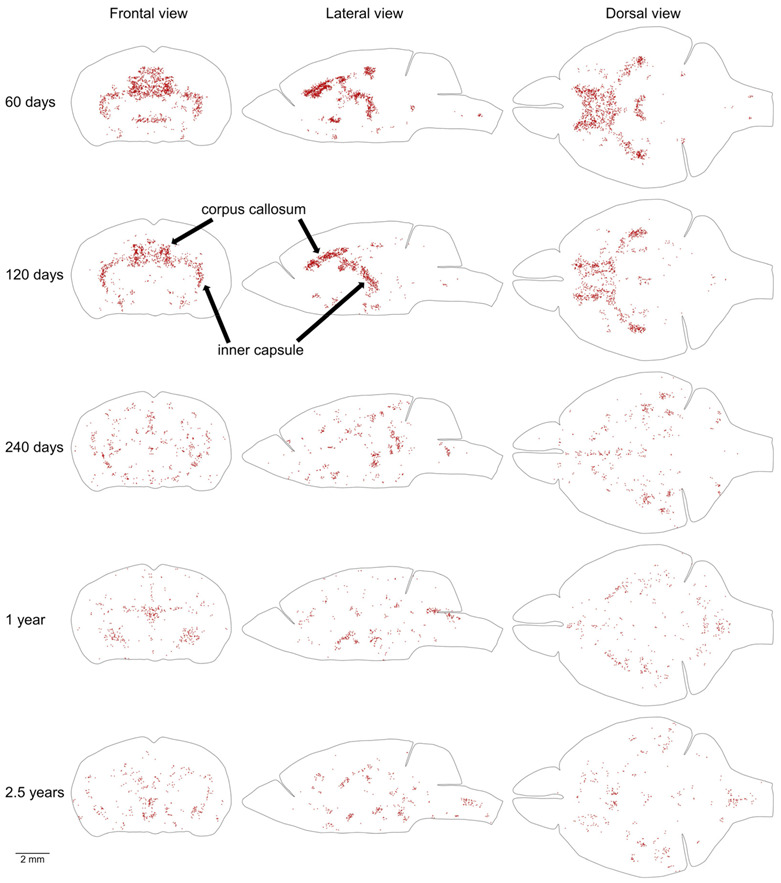
Figure 7.

Distribution of proliferating cells in areas with the highest density of proliferating cells outside of the MPZ and SGZ. The distribution of 20% of cells located outside of the MPZ and SGZ that have the highest volume number density is shown. To exclude cells located in the random aggregations of proliferating cells we show only cells in the areas with higher density on both sides of the brain. Each EdU-labeled nucleus is shown as a red dot. The brain shape is outlined with a black line. Frontal, lateral, and dorsal views of the brain are shown. Mouse age is shown on the left. The size scale is shown at the bottom.
