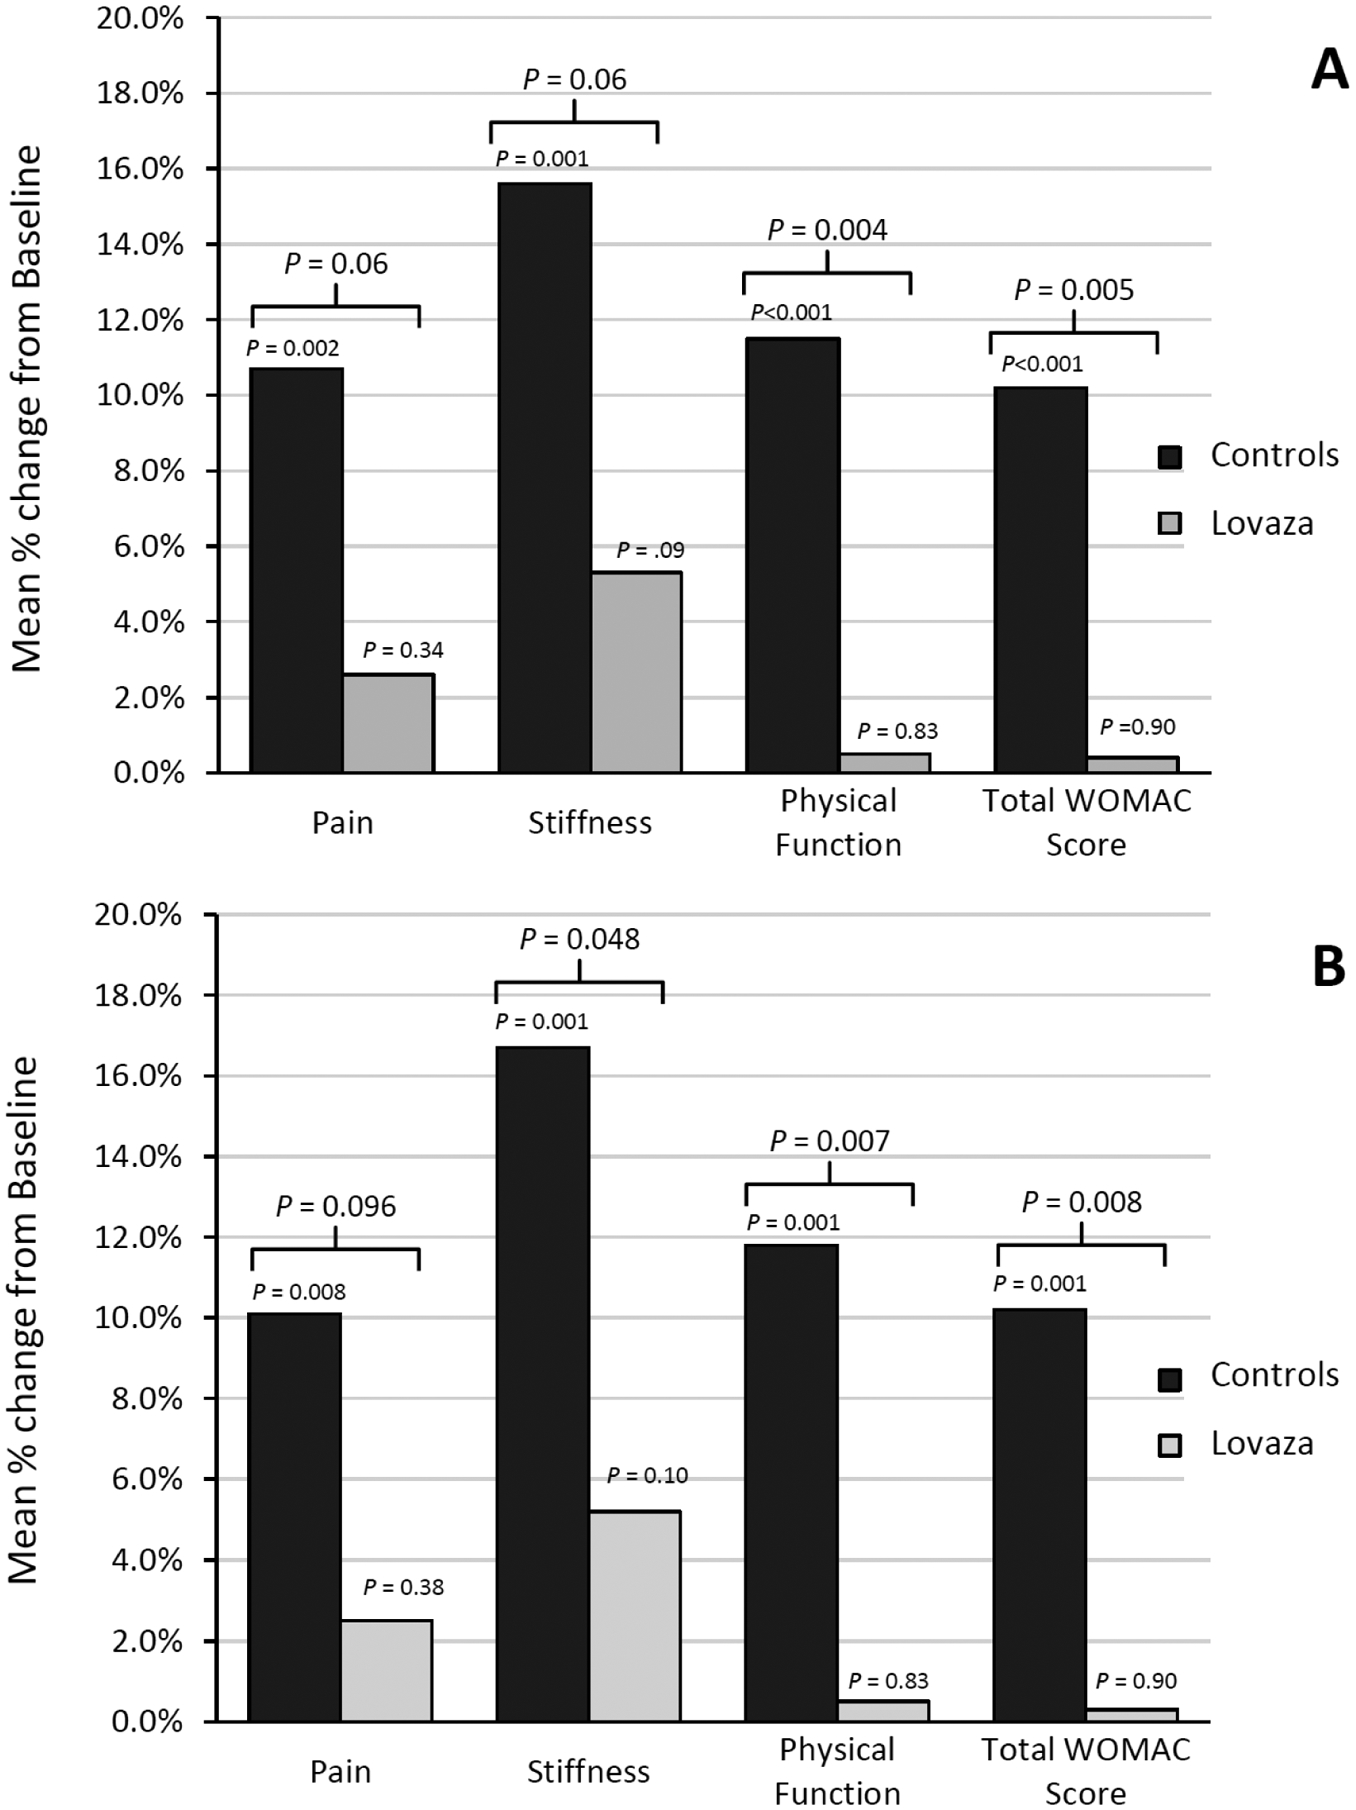
Figure 2.

Mean percent change from baseline at 1-year follow-up for WOMAC scores aoccording to the intention-to-treat (panel A) and per-protocol analysis (Panel B) in the control and Lovaza groups. A lower % change indicates less pain and stiffness and better physical function. WOMAC indicates Western Ontario and McMaster Universities Arthritis Index.
