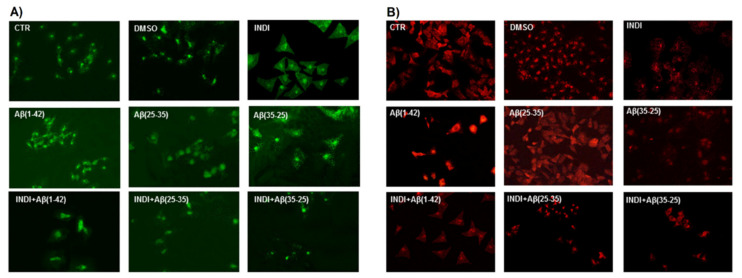
Figure 4.
Staining of total intracellular reactive oxygen species (ROS) levels and O2−. Total intracellular ROS levels (A) and O2− (B) generation in OECs in different conditions: control, DMSO, 100 µM indicaxanthin (INDI), 10 μM Aβ(1-42) or Aβ(25-35 ) or Aβ(35-25) both in the absence and presence of 100 µM INDI for 24 h. Scale bar 20 µm.

