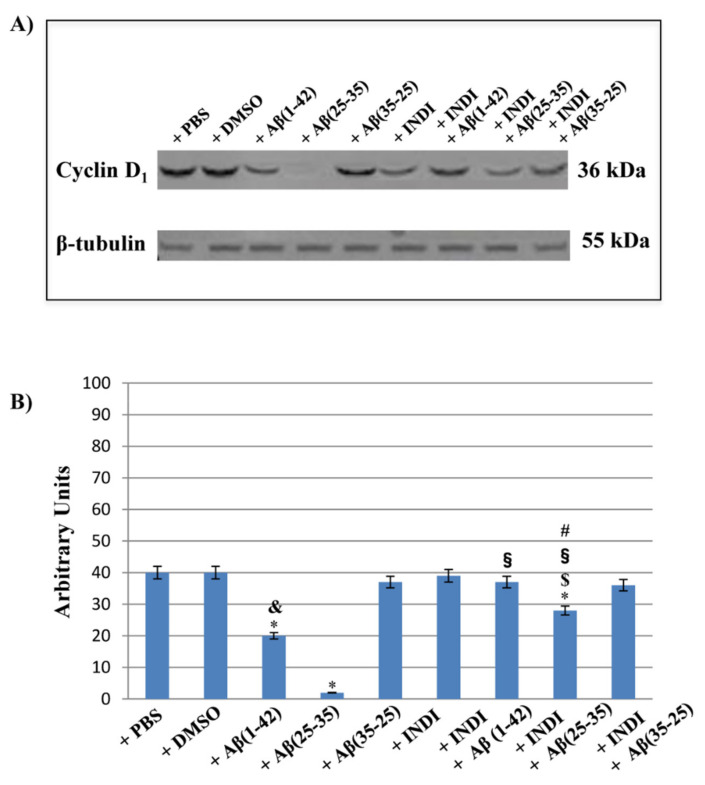
Figure 9.
Western blotting analysis. (A) Representative immunoblot through western blotting analysis for cyclin D1 expression levels in total cellular lysates from OECs in different conditions: control, DMSO, 100 µM indicaxanthin, 10 μM Aβ(1-42) or Aβ(25-35) or Aβ(35-25) both in the absence and presence of 100 µM indicaxanthin for 24 h. (B) Densitometric analysis of cyclin d1 expression levels performed after normalization with β-tubulin. The results are expressed as the mean ± S.D. of the values of five separate experiments performed in triplicate. * p < 0.05 significant differences vs. controls. $ p < 0.05 significant differences of Aβ(1-42) + INDI or Aβ(25-35) + INDI or Aβ(35-25) + INDI vs. INDI; § p < 0.05 significant differences of Aβ(1-42) + INDI vs. Aβ(1-42), Aβ(25-35) + INDI vs. Aβ(25-35) or Aβ(35-25) + INDI vs. Aβ(35-25); & p < 0.05 significant differences of Aβ(1-42) vs. Aβ(25-35 ) or vs. Aβ(35-25); # p < 0.05 significant differences of Aβ(25-35) + INDI vs. Aβ(1-42) + INDI or vs. Aβ(35-25) + INDI.

