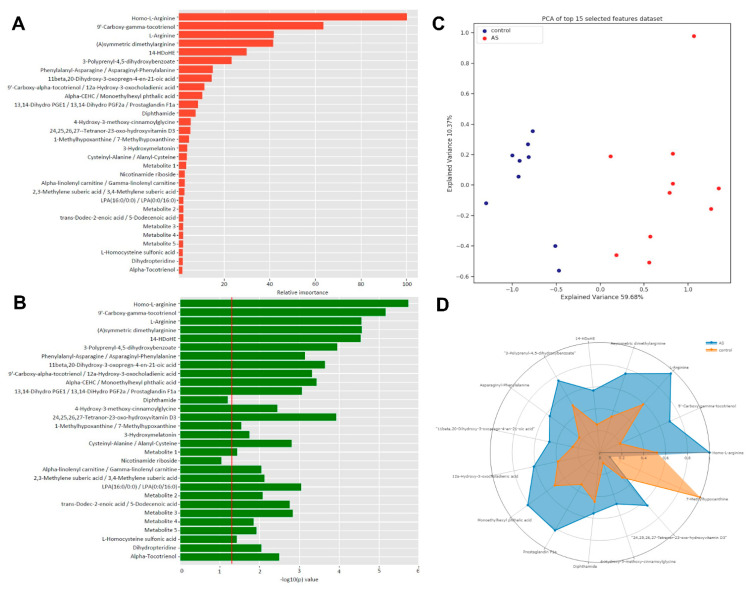
Figure 1.
(A): The x-axis depicts the relative variable importance (%) of a specific metabolite to the distinguishing capacity of the 30 biomarker panel. (B): The x-axis depicts FDR corrected −10log(p) values, which represents the individual capacity of a metabolite to distinguish between control and AS. (C): PLS-DA plot shows good separation between control and AS groups. (D): Radar plot of top 15 metabolites visualizes the distinguishing capacity of individual metabolites.

