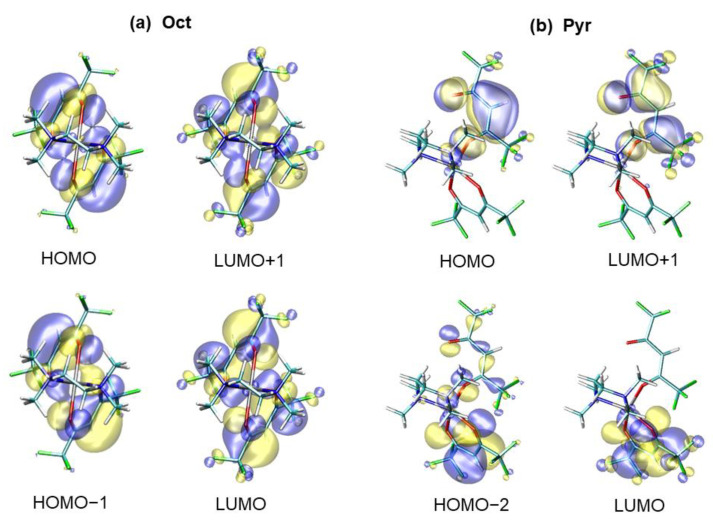
Figure 4.
(a) Molecular orbitals (MOs) involved in the π–π* ligand-to-ligand electronic transitions for Zn(hfa)2TMEDA-Oct in ethanol. The main components of the transition were at λ = 273 nm (oscillator strength = 0.376) (HOMO → LUMO+1 and HOMO−1 → LUMO excitations) and λ = 281 nm (oscillator strength = 0.109) (HOMO → LUMO and HOMO−1 → LUMO+1 excitations). (b) MOs involved in the π–π* ligand-to-ligand electronic transitions for Zn(hfa)2TMEDA-Pyr in ethanol. Main components at λ = 269 nm (oscillator strength = 0.383) (HOMO→ LUMO+1 excitation) and λ = 276 nm (oscillator strength = 0.252) (HOMO−2 → LUMO excitation). Blue and yellow colors mark positive and negative phases of the MOs, respectively.

