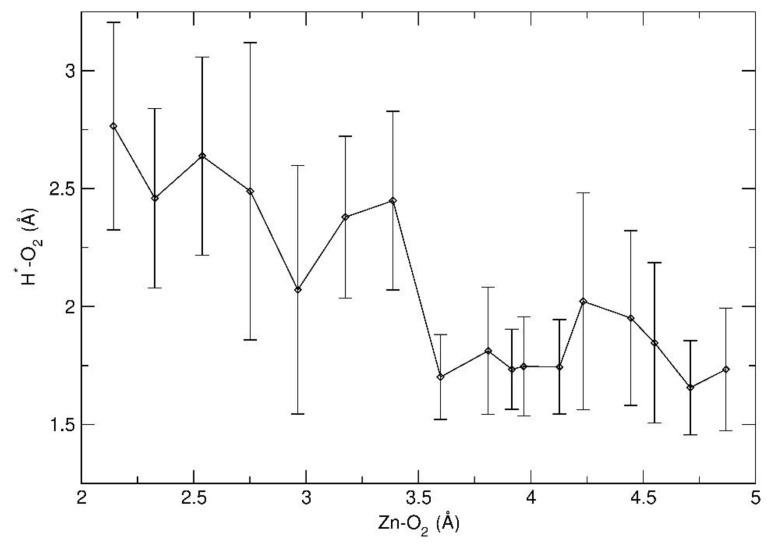
Figure 8.
Variation of the average distance between the surface hydroxyl proton H* and the hfa oxygen O2′ as a function of the Zn-O2′ distance (reaction coordinate). Vertical bars represent the standard deviations, which are an estimate of the amplitude of the thermal oscillations of the O2′-H* distance. The black dots correspond to the BM-sampled values of the Zn-O2′ distance.

