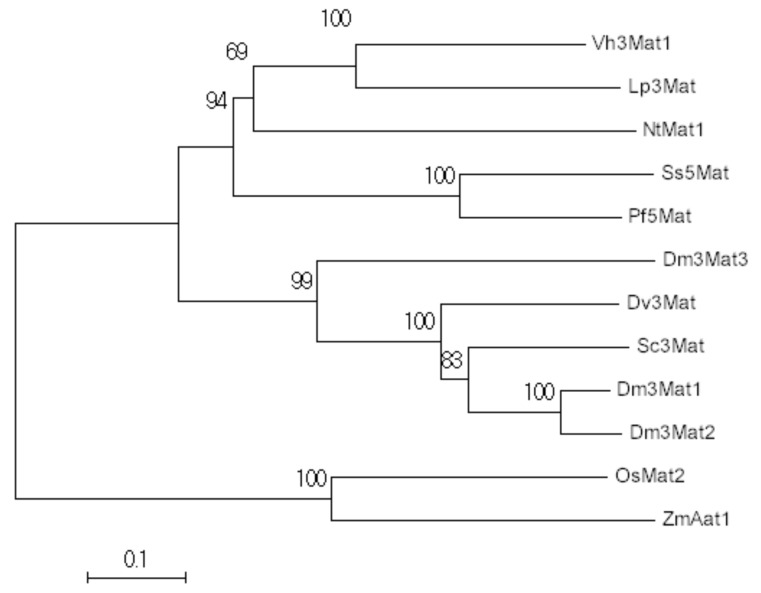
Figure 2.
Phylogenetic analysis of flavonoid malonyltransferases. From top to bottom: Glandularia × hybrida Vh3Mat1 (AAS77402.1), Lamium purpureum Lp3Mat (AAS77404.1), Nicotiana tabacum NtMat1 (BAD93691.1), Salvia splendens Ss5Mat (AAL50566.1), Perilla frutescens Pf5Mat (AAL50565.1), Chrysanthemum × morifolium Dm3Mat3 (BAF50706.1), Dahlia pinnata Dv3Mat (Q8GSN8.1), Pericallis cruenta Sc3Mat (AAO38058.1), Chrysanthemum × morifolium Dm3Mat1 (AAQ63615.1), Chrysanthemum × morifolium Dm3Mat2 (AAQ63616.1), Oryza sativa OsMat1 (NP_001046855.1), Zea mays ZmAat1 (NP_001148286.2). The evolutionary history was inferred using the Neighbor-Joining method [17]. The percentage of replicate trees in which the associated taxa clustered together in the bootstrap test (10,000 replicates) are shown next to the branches [18]. The tree is drawn to scale, with branch lengths in the same units as those of the evolutionary distances used to infer the phylogenetic tree. The evolutionary distances were computed using the Poisson correction method [19]. Evolutionary analyses were conducted in MEGA7 [20].

