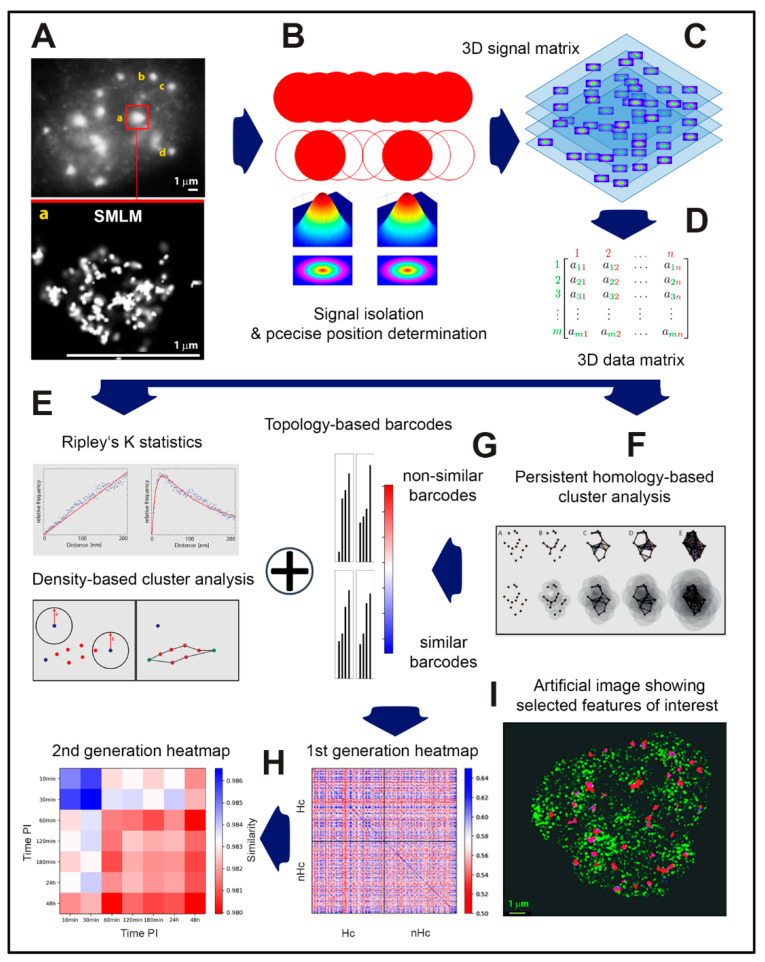
Figure 1.
SMLM data acquisition and analysis procedure. After acquiring of a wide field image (A = part of Figure 2 for illustration; for further details, subfigures and scale bar see figure legend there), fluorochromes specifically attached to the targets are “reversibly” bleached by a powerful laser pulse. Subsequently, individual fluorochromes (labeling individual molecules of interest) randomly return to the fluorescent state, quench again, and then repeatedly oscillate between these states; i.e., they blink. Acquisition of a time series of several hundred to thousand image frames (B) allows registration of individual signals in a time sequence and thus their separation in space. This separation enables precise localization of individual signals with a precision far below the Abbe limit (currently up to 10 nm) (C). The localization of each isolated image point (i.e., localization of its intensity barycenter) (C) provides a 2D or 3D matrix of point signals that can be easily converted to a 3D coordinate matrix (extended for some other signal parameters, such as localization error) (D). The obtained 3D coordinate matrix is processed by various mathematical approaches, including, for instance, Ripley’s K statistics (also see for comparison Figure 3), density-based cluster analysis (E; Note: This figure is a modified part of a figure originally published under CC BY licence in [67]) and persistent homology-based cluster analysis (F; Note: This figure is a modified part of a figure originally published under CC BY licence in [79]). By these mathematical approaches, nanostructures (repair protein complexes, receptors, specific chromatin domains, etc.) are identified and described in a topologically invariant way. Topology in the sense of mathematics means that the results are not influenced by the orientation or scale deformation of nanostructures, thus allowing mutual (topological) comparison of individual nanostructures within a particular cell (nucleus) as well as among cells (cell nuclei) (F). In addition, using persistence homology analysis, 3D objects can easily be described by one dimensional barcodes (G) that can easily be compared, e.g., in the form of heatmaps. The similarity of individual barcodes can be mathematically evaluated and expressed in terms of similarity values (for instance, Jaccard index between 0 and 1) and graphically coded by a color gradient. By comparing each nanostructure versus each nanostructure, so-called 1st generation heatmaps ((H), right) can be constructed, giving a visual summary of topological relationships between all nanostructures. For instance, mutual similarity of DSB repair complexes (IRIFs) can be studied in dependence of their localization in heterochromatin or euchromatin ((H), right). By averaging the heatmaps for all nanostructures within a particular sample (e.g., a given IR dose, PI time, etc.), 2nd generation heatmaps ((H), left) can be computed that visualize nanostructure topological changes in dependence of various factors. Based on mathematically processed data matrices, artificial images can be generated that emphasize various features of interest, such as IRIF formation, colocalization, etc., without a need for complicated image data analysis; heterochromatin (green) and γH2AX foci (red), blue signals correspond to signal overlap of the two channels. (I). Note: For Figure 1E–H, examples and applications are shown in the results.

