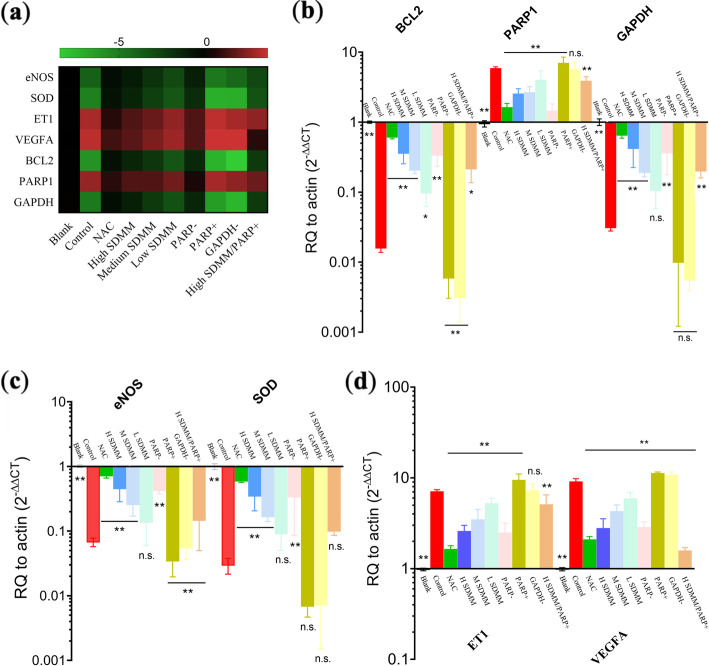
Fig. 8.
RT-qPCR (n = 3). RT-qPCR was performed to determine mRNA expression of eNOS, SOD, ET1, VEGFA, BCL2, PARP1, and GAPDH. a is the heatmap (−△△CT) and (b,c,d) display the fold change (2-△△CT) of those gene. It’s clearly shown that eNOS, SOD, BCL2, and GAPDH were downregulated in Control group, whereas, ET1, VEGFA, and PARP1 were upregulated in Control group. SDMM showed dose-dependent ability to resist above regulations. (**: versus Control group, P<0.01; *: versus Control group, P<0.05; n.s.:versus Control group, P>0.05)

