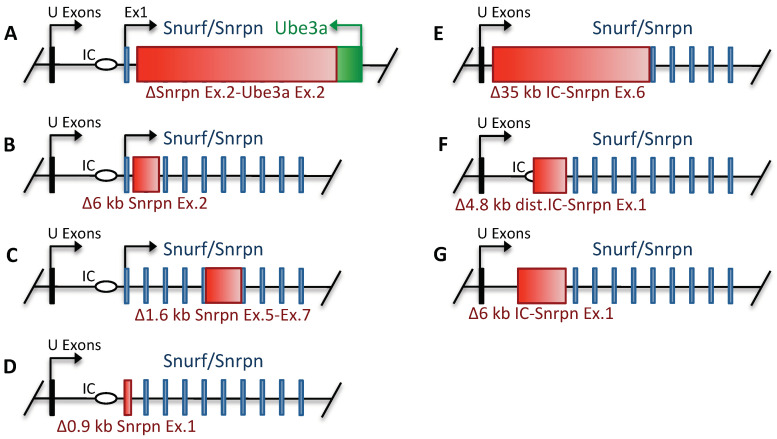
Figure 2.
Schematic representation of genetically engineered mouse models harboring deletions within Snurf/Snrpn and PWS IC center (drawings are not to scale). Green and thin blue rectangles denote Ube3a and Snurf/Snrpn CDS exons, respectively. The red rectangles indicate generated genomic deletions. Thin black rectangles show location of U-exons; the imprinting center (IC) is denoted by a horizontal oval. (A). Large deletion of the genomic region between Snurf/Snrpn exon 2 and Ube3a exon 2. [41]. (B). Inactivation of the Snurf ORF by deleting the 6 kb region including Snurf/Snrpn exon 2 [41]. (C). Intragenic deletion of 1.6 kb within Snurf/Snrpn including exon 6 and parts of exons 5 and 7 disrupting the Snrpn ORF [45]. (D). Small 0.9 kb deletion of the major Snurf/Snrpn promoter together with first CDS exon [46]. (E). The PWS IC deletion, spanning 35 kb (originally described as 42 kb) including Snurf/Snrpn exons 1–6 [45]. (F). Deletion of 4.8 kb (later revealed to be 5.07 kb in size) genomic region, including Snurf/Snrpn exon 1 and the distal part of the PWS IC [46]. (G). The 6 kb deletion comprising PWS IC and Snurf/Snrpn exon 1 [47].

