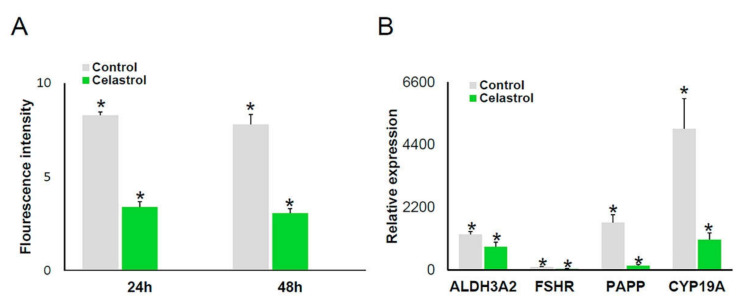
Figure 3.
Effects of celastrol addition on OS and gene expression in cultured hGL cells. (A) Histogram showing OS levels in hGL cells after celastrol treatment; n = 3. (B) ALDH, FSHR, PAPP, and CYP19A1 gene expression in control (n = 27) and celastrol-treated cells (n = 18). Asterisks (*) indicate statistically significant differences compared to control.

