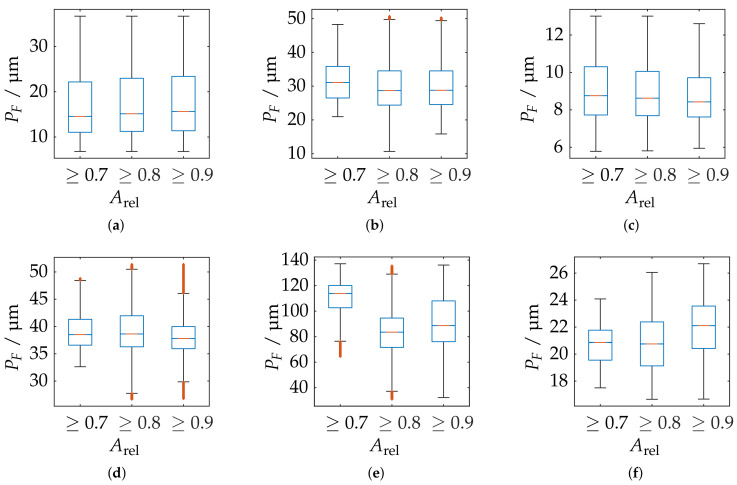
Figure 24.
Statistical representation of the probing error form of all measuring poses with limitation of the measuring range by different threshold values of the relative spherical coverage . Orange line: Median, Blue box: Upper and lower quartile, Whisker = 1.5 (99.3 percent coverage), Orange dots: Outlier. (a) ATOS Compact Scan 2M MR 2. (b) ATOS Core 200 5M. (c) ATOS Compact Scan 2M MR 1. (d) TR 73 Endo 20. (e) LMI/GFM MikroCad pico. (f) TR 73 Endo 10.

