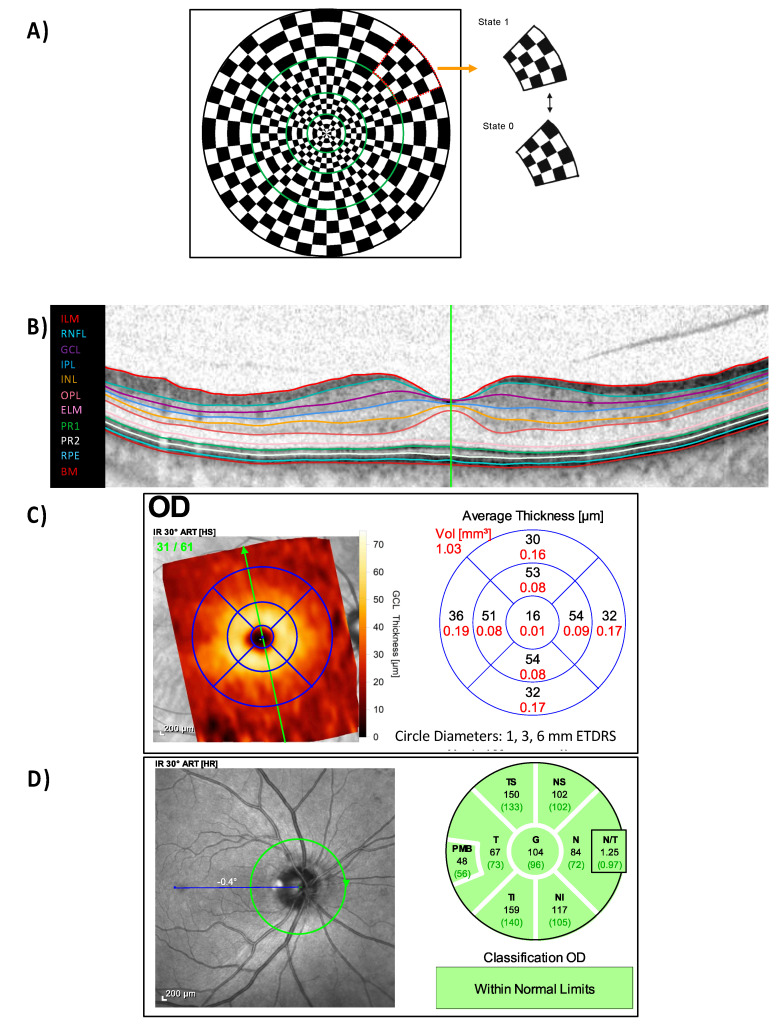
Figure 4.
Electroretinography (ERG) and optical coherence tomography (OCT) measurements. (A) mfPERG stimulus with 36 checkerboard elements, where each element (dotted red) reverses the pattern between 1 and 0 states. The stimulus (xx° diameter) spanned 4 eccentricity ranges outlined by green line. (B) Macular vertical scan with segmentation line, (C) Early Treatment for Diabetic Retinopathy Study’s (ETDRS) circle, i.e., 1 mm (foveal), 3 mm (parafoveal), and 6 mm (perifoveal) circles, analysis of the ganglion cell layer (GCL), and (D) peripapillary area scan with different sector thickness. ILM = internal limiting membrane; RNFL = retinal nerve fiber layer thickness; GCL = ganglion cell layer; IPL = inner plexiform layer; INL = inner nuclear layer; OPL = outer plexiform layer; ELM = external limiting membrane; PR1 = photoreceptor inner segments; PR2 = photoreceptors outer segments; RPE = retinal pigment epithelium; BM = Bruch’s membrane. Peripapillary retinal nerve fiber layer thickness: G = global average thickness; T = temporal; PMB = papillomacular bundle; N/T: nasal/temporal ratio; S: superior; I: Inferior.

