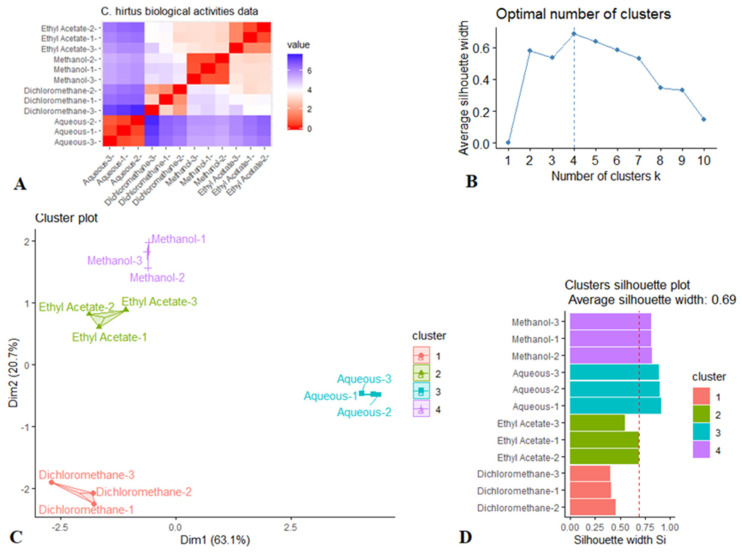
Figure 9.
A k-medoids clustering analysis of biological activities of C. hirtus. (A) Distance matrix showing the dissimilarity between each pair of subjects (Red color: high similarity, Blue color: low similarity). (B) Number of clusters. (C) Scatter plot. (D) Silhouette plot displaying the average distance between clusters.

