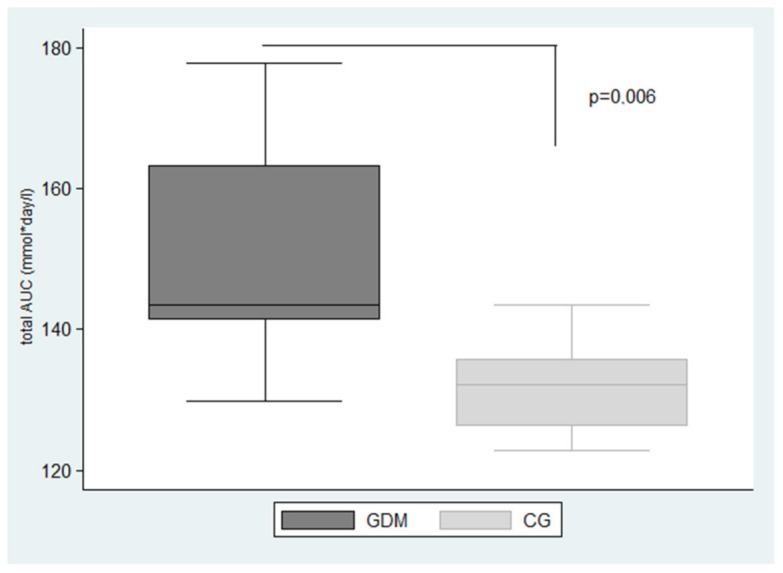
Figure 2.

Box plot graph: the significant difference in glycaemic variability in GDM and CG compared by Total AUC (range 7.8–3.5 mmol/L). Data expressed as median (interquartile range): GDM, gestational diabetes mellitus; CG, control group; Total AUC, the area under the interstitial glucose concentration curve for the entire day. The significance is set at p < 0.05.
