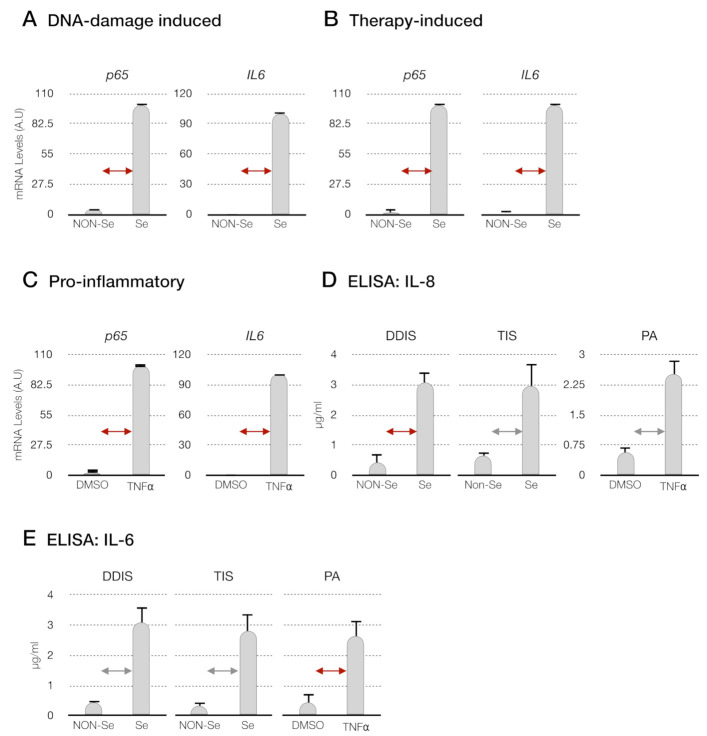
Figure 3.
Evaluation of the p65 pathway in cellular senescence and proinflammatory activation; qPCR to determine the mRNA p65 expression in (A) DNA damage-induced senescence (DDIS), (B) therapy-induced senescence (TIS) and (C) proinflammatory activation (PA) in mesenchymal stem cells (MSCs). Data represent the mean ± SD of three independent experiments. Nonparametric Kolmogorov–Smirnov test was used to calculate the significance, and it was represented as  p < 0.05 and
  p < 0.01 (D) levels of interleukin-8 (IL-8) and (E) interleukin-6 (IL-6) in the conditioned medium from senescent cells (DDIS and TIS) and proinflammatory-activated MSCs. Data shows the mean ± SD of three independent experiments. Nonparametric Kolmogorov–Smirnov test was used to calculate the significance, and it was represented as
  p < 0.05 and
  p < 0.01. A.U: arbitrary units, NON-Se: proliferative or nonsenescent MSCs, Se: senescent (DDIS or TIS) MSCs, DMSO: MSCs treated with DMSO (dimethyl sulfoxide) and TNF-α: MSCs treated with tumor necrosis factor alpha.

