Figure 3.
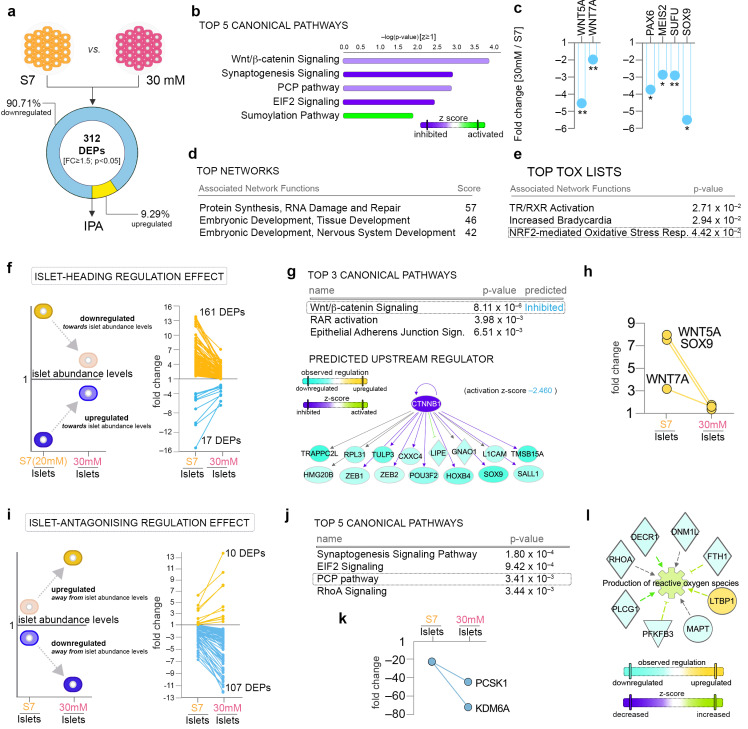
Pathway analysis of 30-mM glucose concentration effect. (a) Analysis workflow depicting the comparison employed. (b) Top canonical pathways with predicted regulation characterizing the 30-mM glucose condition. (c) Graphs of the observed downregulated WNT5A and WNT5B ligands and PAX6, MEIS2 (Meis homeobox 2), SUFU (suppressor of fused protein) and SOX9 (SRY-Box Transcription Factor 9) in the 30 mM glucose condition. (d) Top networks and (e) top tox list characterizing the proteome landscape of the 30 mM glucose condition. (f) Scheme depicting the selection strategy and number of proteins displaying a dynamic of regulations compatible with an islet-heading regulatory pattern in response to 30 mM glucose. (g) Top 3 canonical pathways and the network representation of one of the top predicted upstream regulators’ (Catenin Beta 1, CTNNB1) target molecules. (h) Graphs of WNT5A, WNT7A and SOX9 following an islet-heading regulation pattern. (i) Scheme depicting the selection strategy and number of proteins displaying a dynamic of regulations compatible with an islet-antagonizing regulatory pattern in response to 30 mM glucose. (j) Top 5 canonical pathways characterizing the subgroup of proteins displaying islet-antagonizing regulation. (k) Graphs of the β-cell markers PCSK1 and KDM6A (Lysine Demethylase 6A) presenting an islet-antagonizing regulation pattern. (l) IPA-generated network representations of selected dataset differentially expressed proteins (DEPs) characterizing the corresponding top disease and function processes. * p < 0.05, ** p < 0.01.

