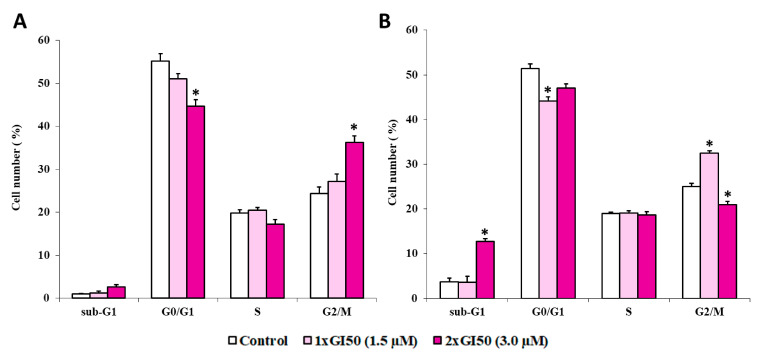
Figure 9.
The effects of J3955 at 2× and 1× its GI50 value on the cell-cycle distribution of HepG2 cells following 12 h (A) and 24 h (B) treatments. Results are expressed as the mean of two independent experiments, performed in duplicate. Statistical analyses were performed using the Student’s t-test to determine the differences between the datasets. * Denotes significant differences (p < 0.0001) from untreated cells (control).

