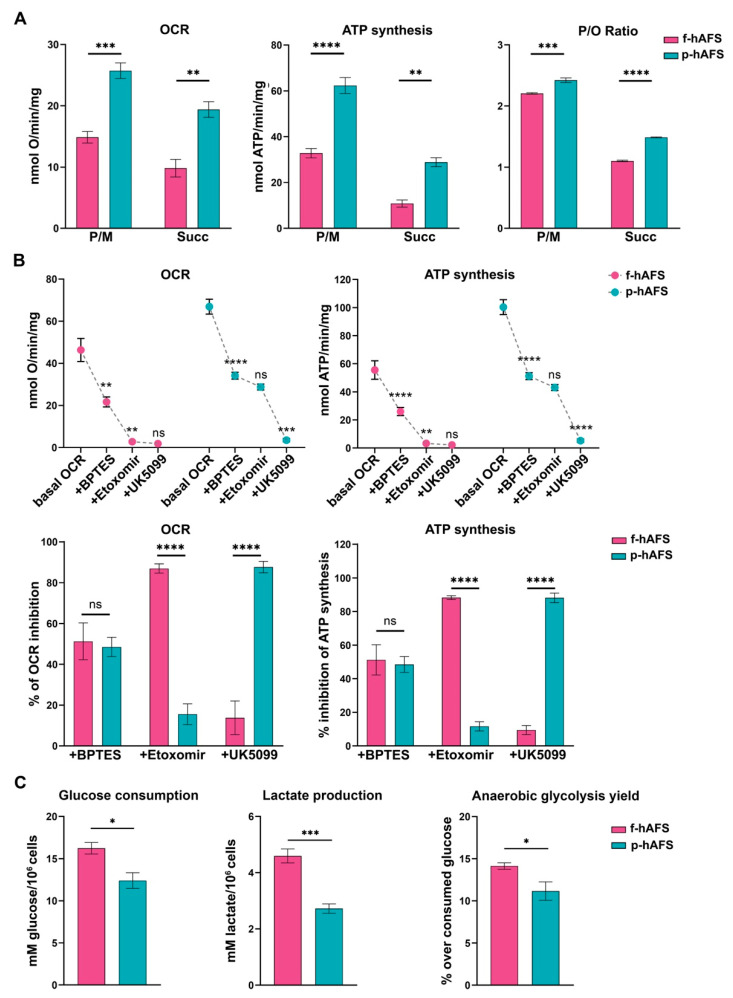
Figure 2.
Metabolic characterization of fetal- and perinatal hAFS. (A) Oxygen consumption rate (OCR), ATP synthesis through F1-Fo ATP synthase, and P/O ratio in f-hAFS and p-hAFS in the presence of pyruvate plus malate (P/M) or succinate (Succ); *** p = 0.0005, ** p = 0.0012, **** p < 0.0001, ** p = 0.0013, *** p = 0.0002, **** p < 0.0001. (B) OCR and ATP synthesis in presence of BPTES, Etomoxir, and UK5099 (upper panel) was sequentially added during the experiments to evaluate the relative contributions of glutamine, long-chain fatty acid oxidation and glucose in OxPhos metabolism in f-hAFS and p-hAFS. For OCR experiments: f-hAFS + BPTES ** p = 0.0014; for f-hAFS + Etomoxir ** p = 0.0088; for p-hAFS + BPTES **** p < 0.0001; for p-hAFS + UK5099 ** p < 0.0001. For ATP experiments: f-hAFS + BPTES **** p < 0.0001; for f-hAFS + Etomoxir ** p = 0.0013; for p-hAFS + BPTES **** p < 0.0001; for p-hAFS + UK5099 ** p < 0.0001). The comparison of percentage of inhibition of OCR and ATP synthesis in f- and p-hAFS due to the inhibitors indicated above is reported in the lower panel B. For OCR experiments: hAFS + Etomoxir **** p < 0.0001; for hAFS + UK5099 **** p < 0.0001. For ATP experiments: hAFS + Etomoxir **** p < 0.0001; for hAFS + UK5099 **** p < 0.0001). (C) Glucose consumption, lactate release and anaerobic glycolysis yield, used as markers of the anaerobic glycolysis, in f-hAFS and p-hAFS. All values are expressed as mean ± s.e.m of n = 4 independent experiments; * p = 0.016, *** p = 0.0008, * p = 0.0416, respectively.

