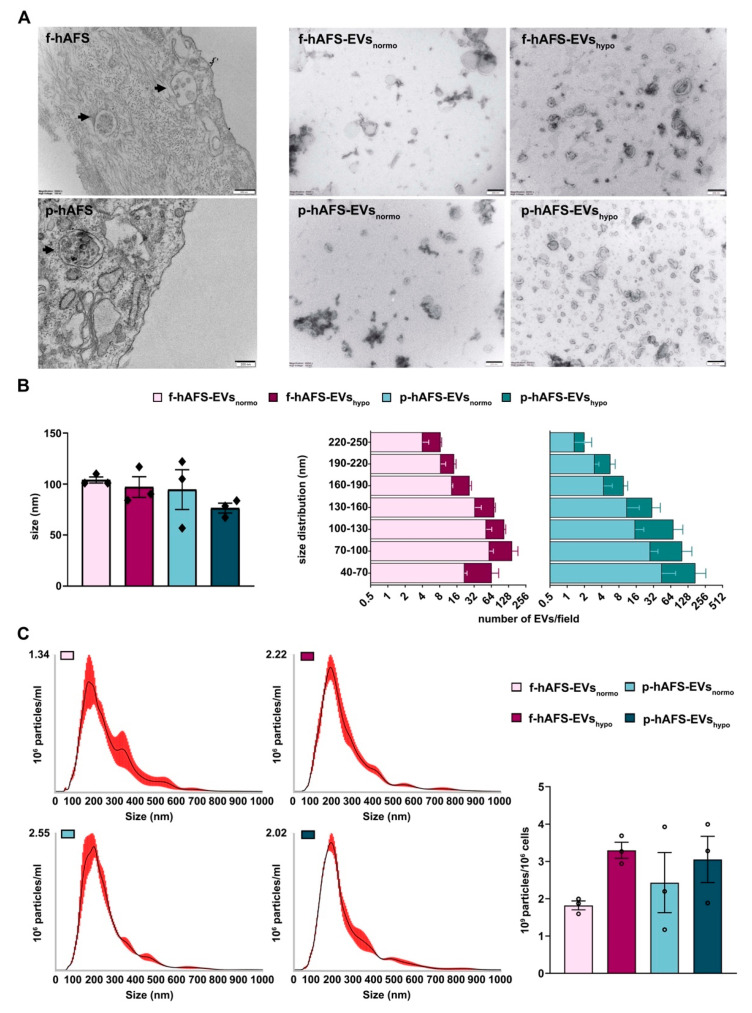
Figure 4.
Morphological characterization of fetal- and perinatal hAFS-EVs. (A) Representative images of transmission electron microscopy (TEM) of: f-hAFS and p-hAFS (upper and lower left panel, respectively, black arrows indicating intracytoplasmic multi-vesicular bodies with small EVs/exosomes within them), and of f-hAFS-EVs and p-hAFS-EVs (upper and lower right panel, respectively) released in serum-free conditions and under normoxic versus hypoxic preconditioning (f-hAFS-EVsnormo; f-hAFS-EVshypo; p-hAFS-EVsnormo; and p-hAFS-EVshypo, respectively), scale bars: 200 nm. (B) Left panel: TEM analysis of hAFS-EVs size distribution; right panel: distribution of the number f-hAFS-EVs and p-hAFS-EVs per field size intervals from 40 nm up to 250 nm were considered; values are expressed as mean ± s.e.m of n = 3 independent experiments. (C) Nanoparticle tracking analysis for hAFS-EVs size and distribution. Left panel: representative image of the graphical output; right panel: hAFS-EVs concentration measured as 109 particles per 106 secreting cells; nm: nanometer; mL: milliliter.

