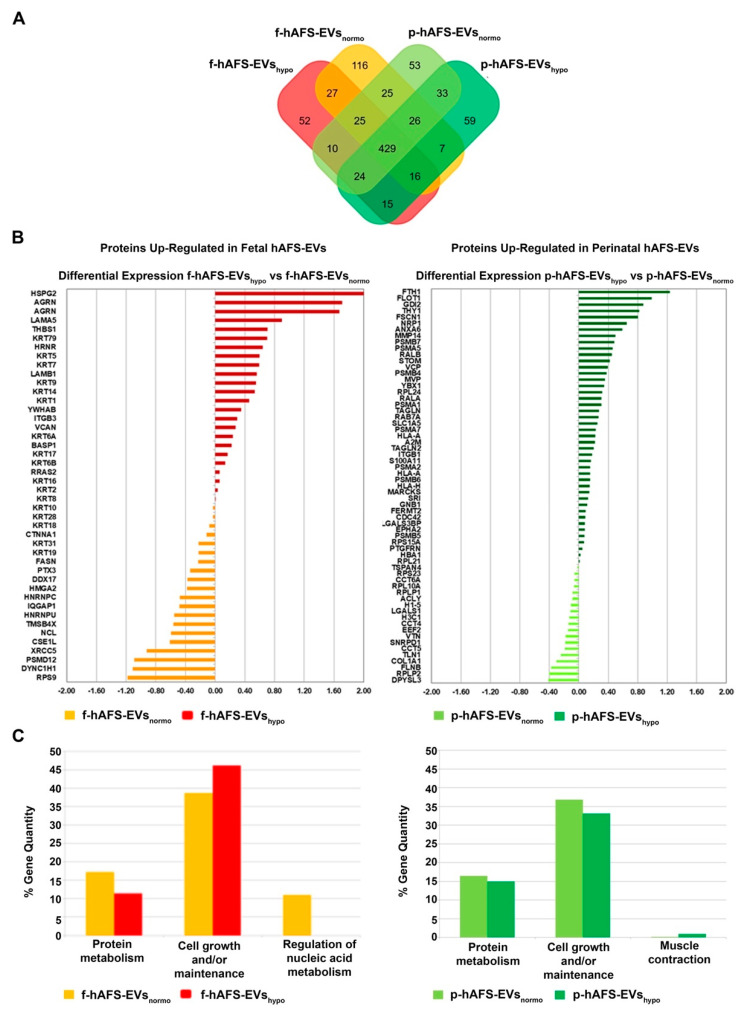
Figure 6.
Comparative proteomics analysis of fetal- and perinatal hAFS-EVs. (A) Venn diagram illustrating the distribution of proteins identified with a frequency of at least 2 within f-hAFS-EVsnormo (dark yellow), f-hAFS-EVshypo (red), p-hAFS-EVsnormo (light green) and p-hAFS-EVshypo (dark green). (B) Differentially expressed proteins identified in fetal hAFS-EVs (left panel) and perinatal hAFS-EVs (right panel) by label-free quantification with MAProMa software. Left panel: histogram reporting the differential expression of proteins found upregulated between normoxic control (dark yellow bars and negative DAve values) and hypoxic preconditioning (red bars and positive DAve values) of f-hAFS-EVs over p-hAFS-EVs. Right panel: histogram reporting the differential expression of proteins found upregulated between control normoxic (light green bars and negative DAve values) and hypoxic preconditioning (dark green bars and positive DAve values) of p-hAFS-EVs over f-hAFS-EVs. Proteins with DAve (ratio of protein expression) ≥ |0.4| and a DCI (confidence of differential expression) ≥ |5| passed the filters and were considered differentially expressed; see Table S3 for the complete list and detailed parameters of the reported proteins. (C) Biological processes enrichment analysis of proteins identified with a frequency of at least 2 in f-hAFS-EVs (left panel) and p-hAFS-EVs (right panel) after hypoxic preconditioning. Based on FunRich tool, gene ontology terms are shown in bar charts reporting the percentage of genes enriched for each category (dark yellow bars for f-hAFS-EVsnormo, red bars for f-hAFS-EVshypo, light green bars for p-hAFS-EVsnormo and dark green bars for p-hAFS-EVshypo). Only gene ontology terms with Bonferroni corrected * p < 0.05 are reported.

