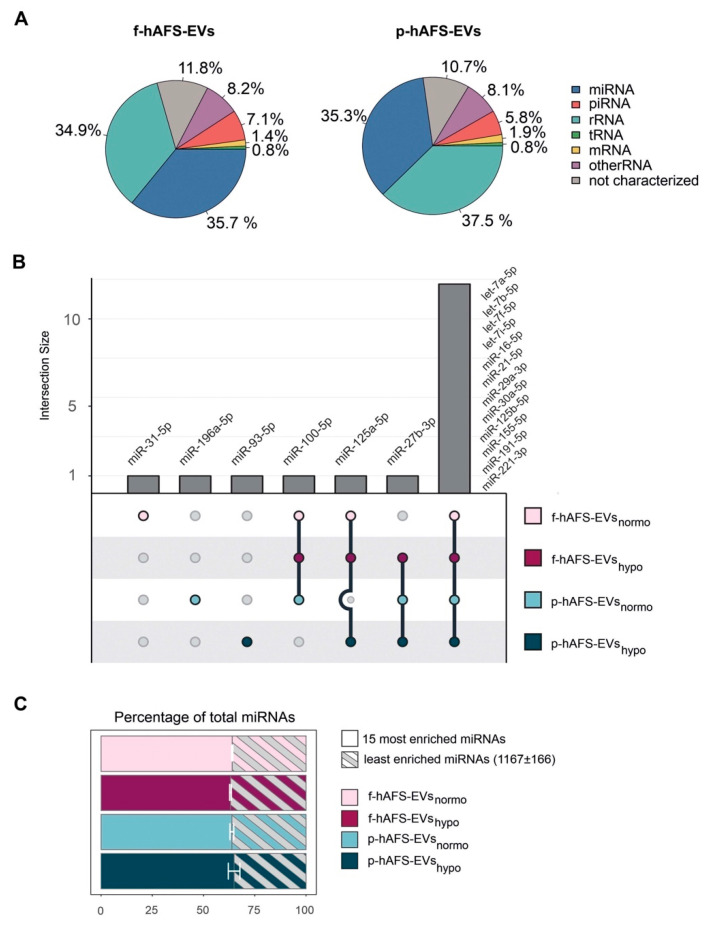
Figure 8.
RNA cargo profiling of fetal- and perinatal hAFS-EVs. (A) Relative percentage distribution of RNA types detected within fetal- vs perinatal hAFS-EVs (f-hAFS-EVs and p-hAFS-EVs, respectively). Slice of pie chart referring to average percentage of RNA amount in f-hAFS-EVs (left panel) and p-hAFS-EVs (right panel) of n = 3 experiments. (B) Upset plot of miRNAs enriched in hAFS-EVs according to gestational stage and cell preconditioning. (C) The 15 most enriched miRNAs within f-hAFS-EVsnormo (64.47 ± 0.28%), f-hAFS-EVshypo (63.84 ± 0.43%); p-hAFS-EVsnormo (64.08 ± 0.92%) and p-hAFS-EVshypo (65.78 ± 2.82%); values are expressed as mean percentage ± s.e.m of n = 3 experiments.

