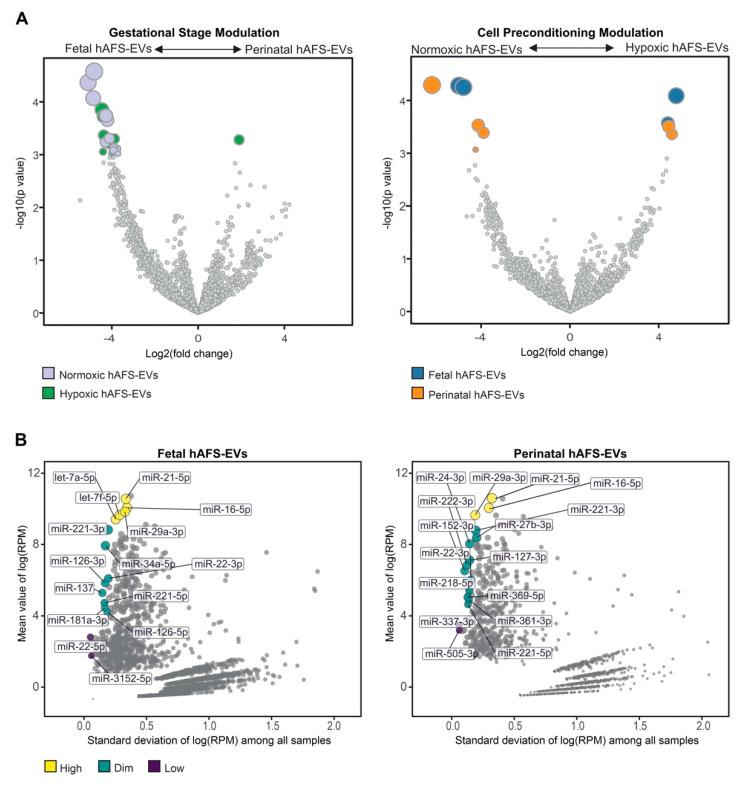
Figure 9.
Analysis of differential enrichment of miRNAs in fetal- and perinatal hAFS-EVs. (A) Volcano plots for differential enrichment of hAFS-EV miRNA cargo according to gestational stage (left panel) and in vitro hypoxic preconditioning of secreting cells (right panel). For miRNA details, please refer to Table 1. (B) Scatter plot of the correlation between variability (X axis) and enrichment level (Y axis) of stable miRNAs within fetal hAFS-EVs (left panel) and perinatal hAFS-EVs (right panel) according to high (yellow dots), dim (green dots) and low (dark purple dots) enrichment. For miRNA details, please refer to Table 2. RPM: reads per million.

