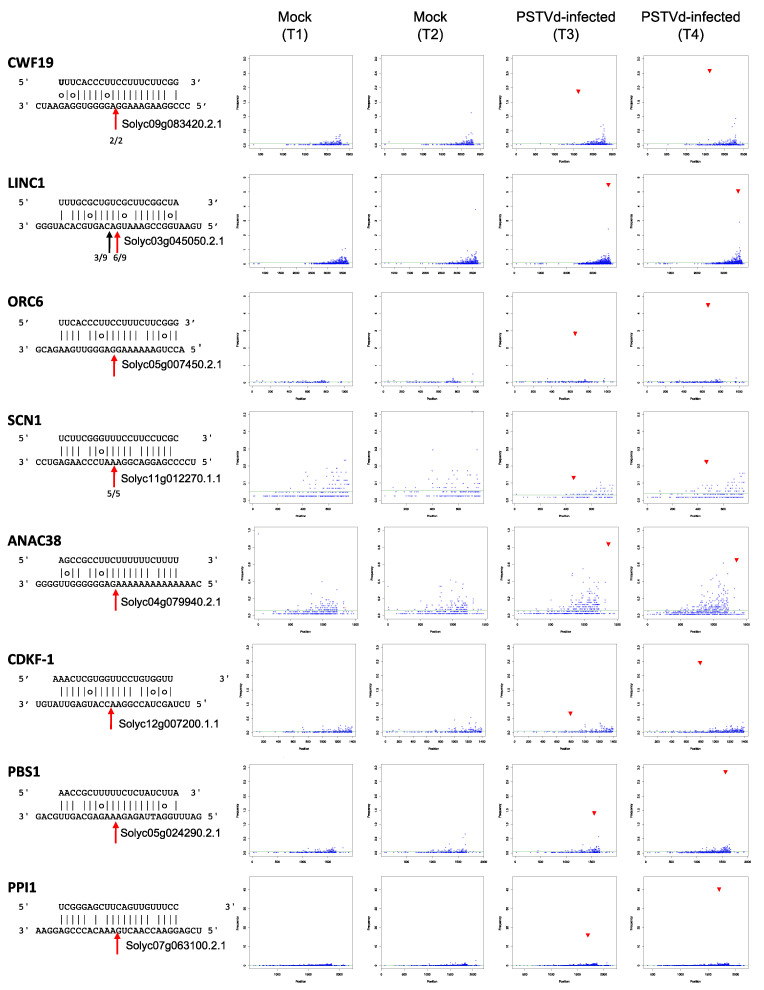
Figure 4.
T-plots of eight bona fide mRNA targets of PSTVd-sRNAs. The abundance of each degradome tag is plotted as a function of the position of its 5′ end in the transcript. In each t-plot, the tag abundance at the cleavage site according with the cognate PSTVd-sRNA is reported in red. The duplex PSTVd-sRNA:mRNA target is shown on the left, with the cleavage site position indicated by a red arrow and the number of RLM–RACE clones validating the cleavage site indicated (in CWF19, LINC1, SCN1).

