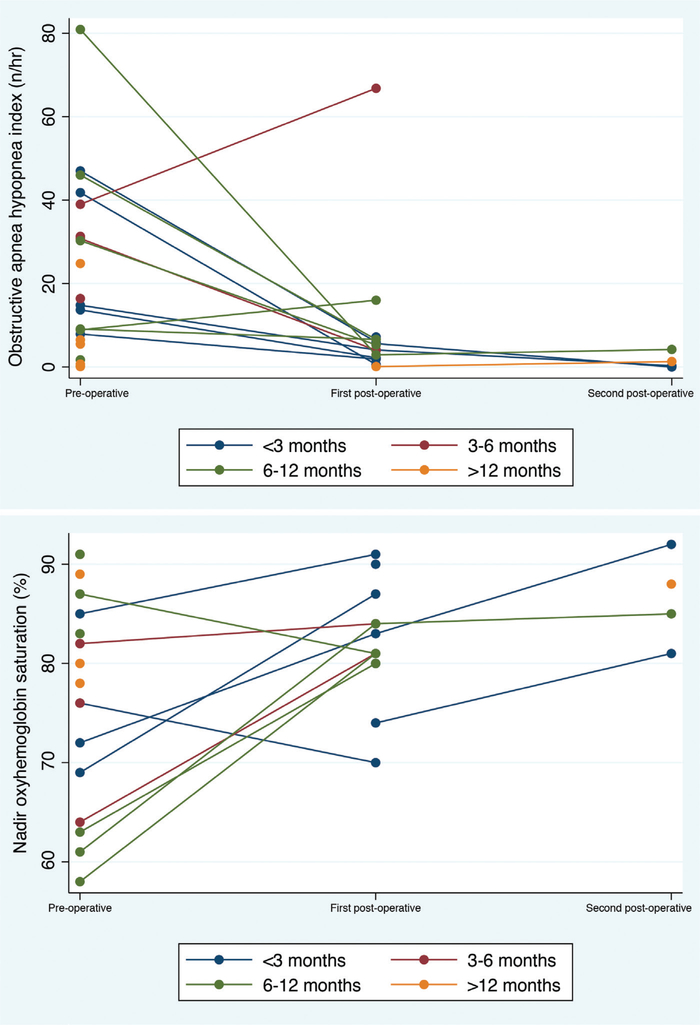
Fig. 2.
Two-way connected plots representing polysomnographic reports for each individual patient at various time points related to their surgery; plots are stratified by age at tongue reduction and coded by color. (Above) Obstructive apnea hypopnea index on polysomnography. (Below) Nadir oxyhemoglobin saturation on polysomnography.

