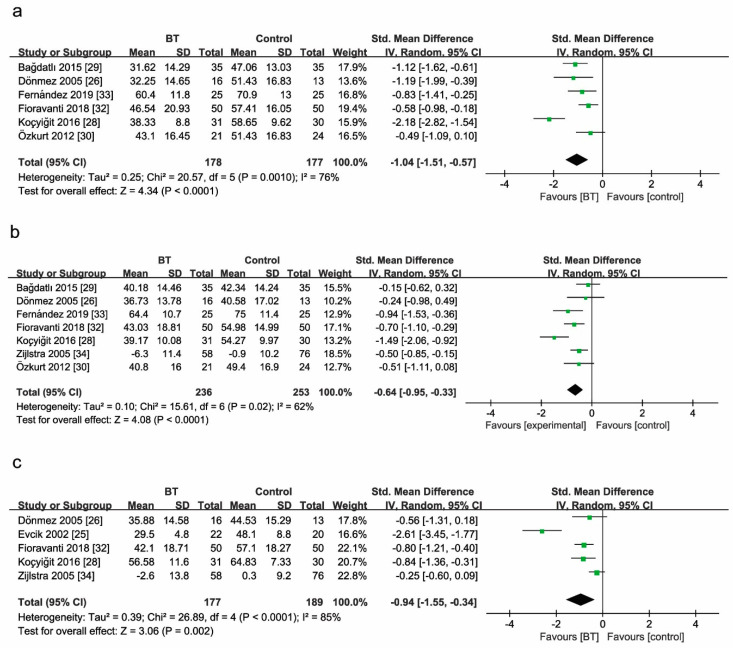
Figure 5.
Forest plot (a) for the comparison of the FIQ score at 2 weeks, showing the effect favoring balneotherapy; (b) at 3 months, showing the effect favoring balneotherapy; and (c) at 6 months, showing the effect favoring balneotherapy. In the figure, the mean indicates mean FIQ values. Green square represent the std. mean difference, bars represent the 95% confidence interval, and black diamond represent the pooled analysis for each FIQ score.

