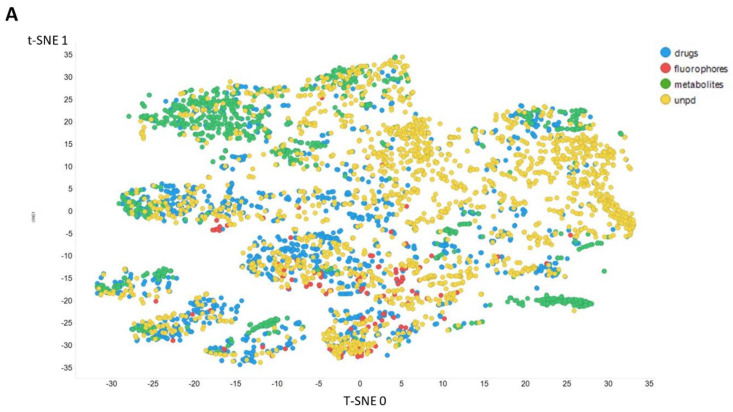
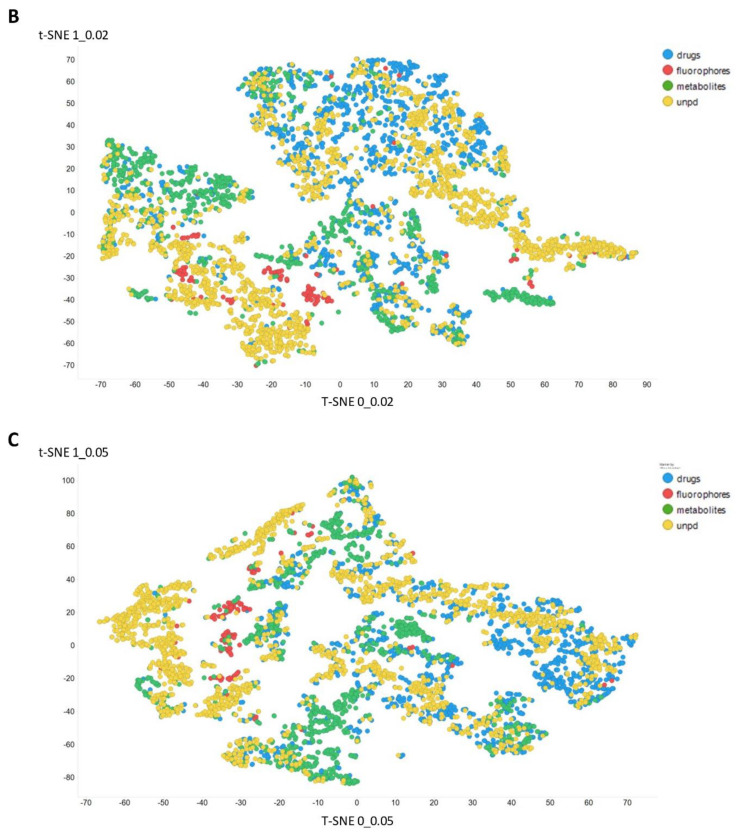
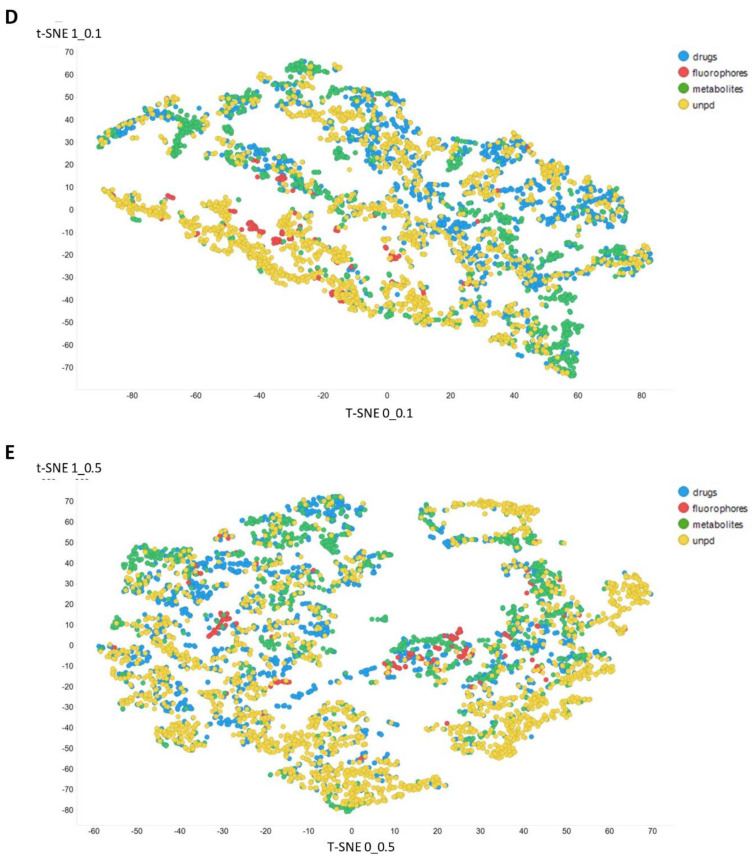
Figure 3.
Effect of adjusting the temperature parameter in the contrastive learning loss on the distribution of molecules in the latent space as visualized via the t-SNE algorithm. For clarity, only a random subset of 2000 natural products is shown. (A) Learning based purely on the cross-entropy objective function. (B–E) The temperature scalar (as in [112]) was varied between 0.02 and 0.5 as indicated. (Reducing t below led to numerical instabilities.) All drugs, fluorophores, and Recon2 metabolites are plotted, along with a randomly chosen 2000 natural products (as in [113]).


