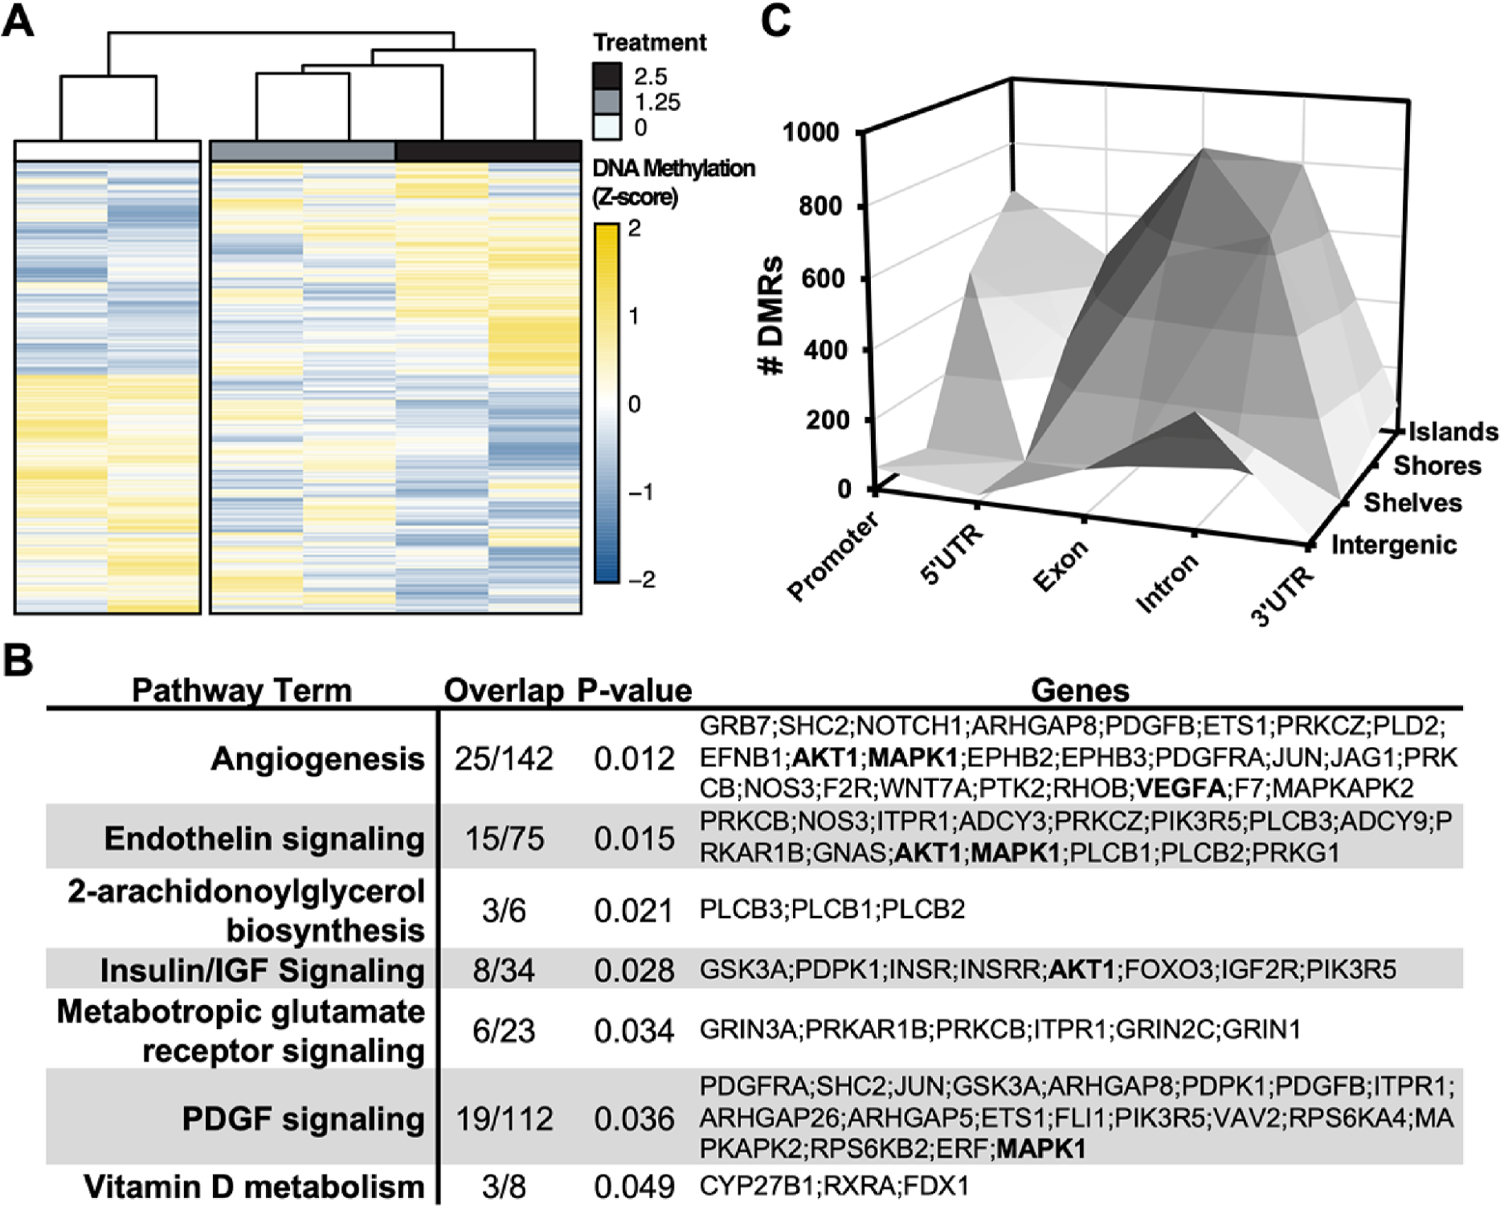
Figure 1: Differential DNA methylation is glucose-responsive in human endothelial cells.

A. Hierarchical clustering via Wald.D2 Test and dendrogram constructed by Euclidean distance with heatmap visualization of differentially methylated regions (DMRs)*. B. 3-dimensional bar plot depicting the distribution of DMRs according to both genic annotation (promoter, intron, exon, and 5’ untranslated regions) and proximity to CpG Islands (CpG Island, Shore, and Shelf). *statistical significance of DMRs assumed at Q < 0.05
