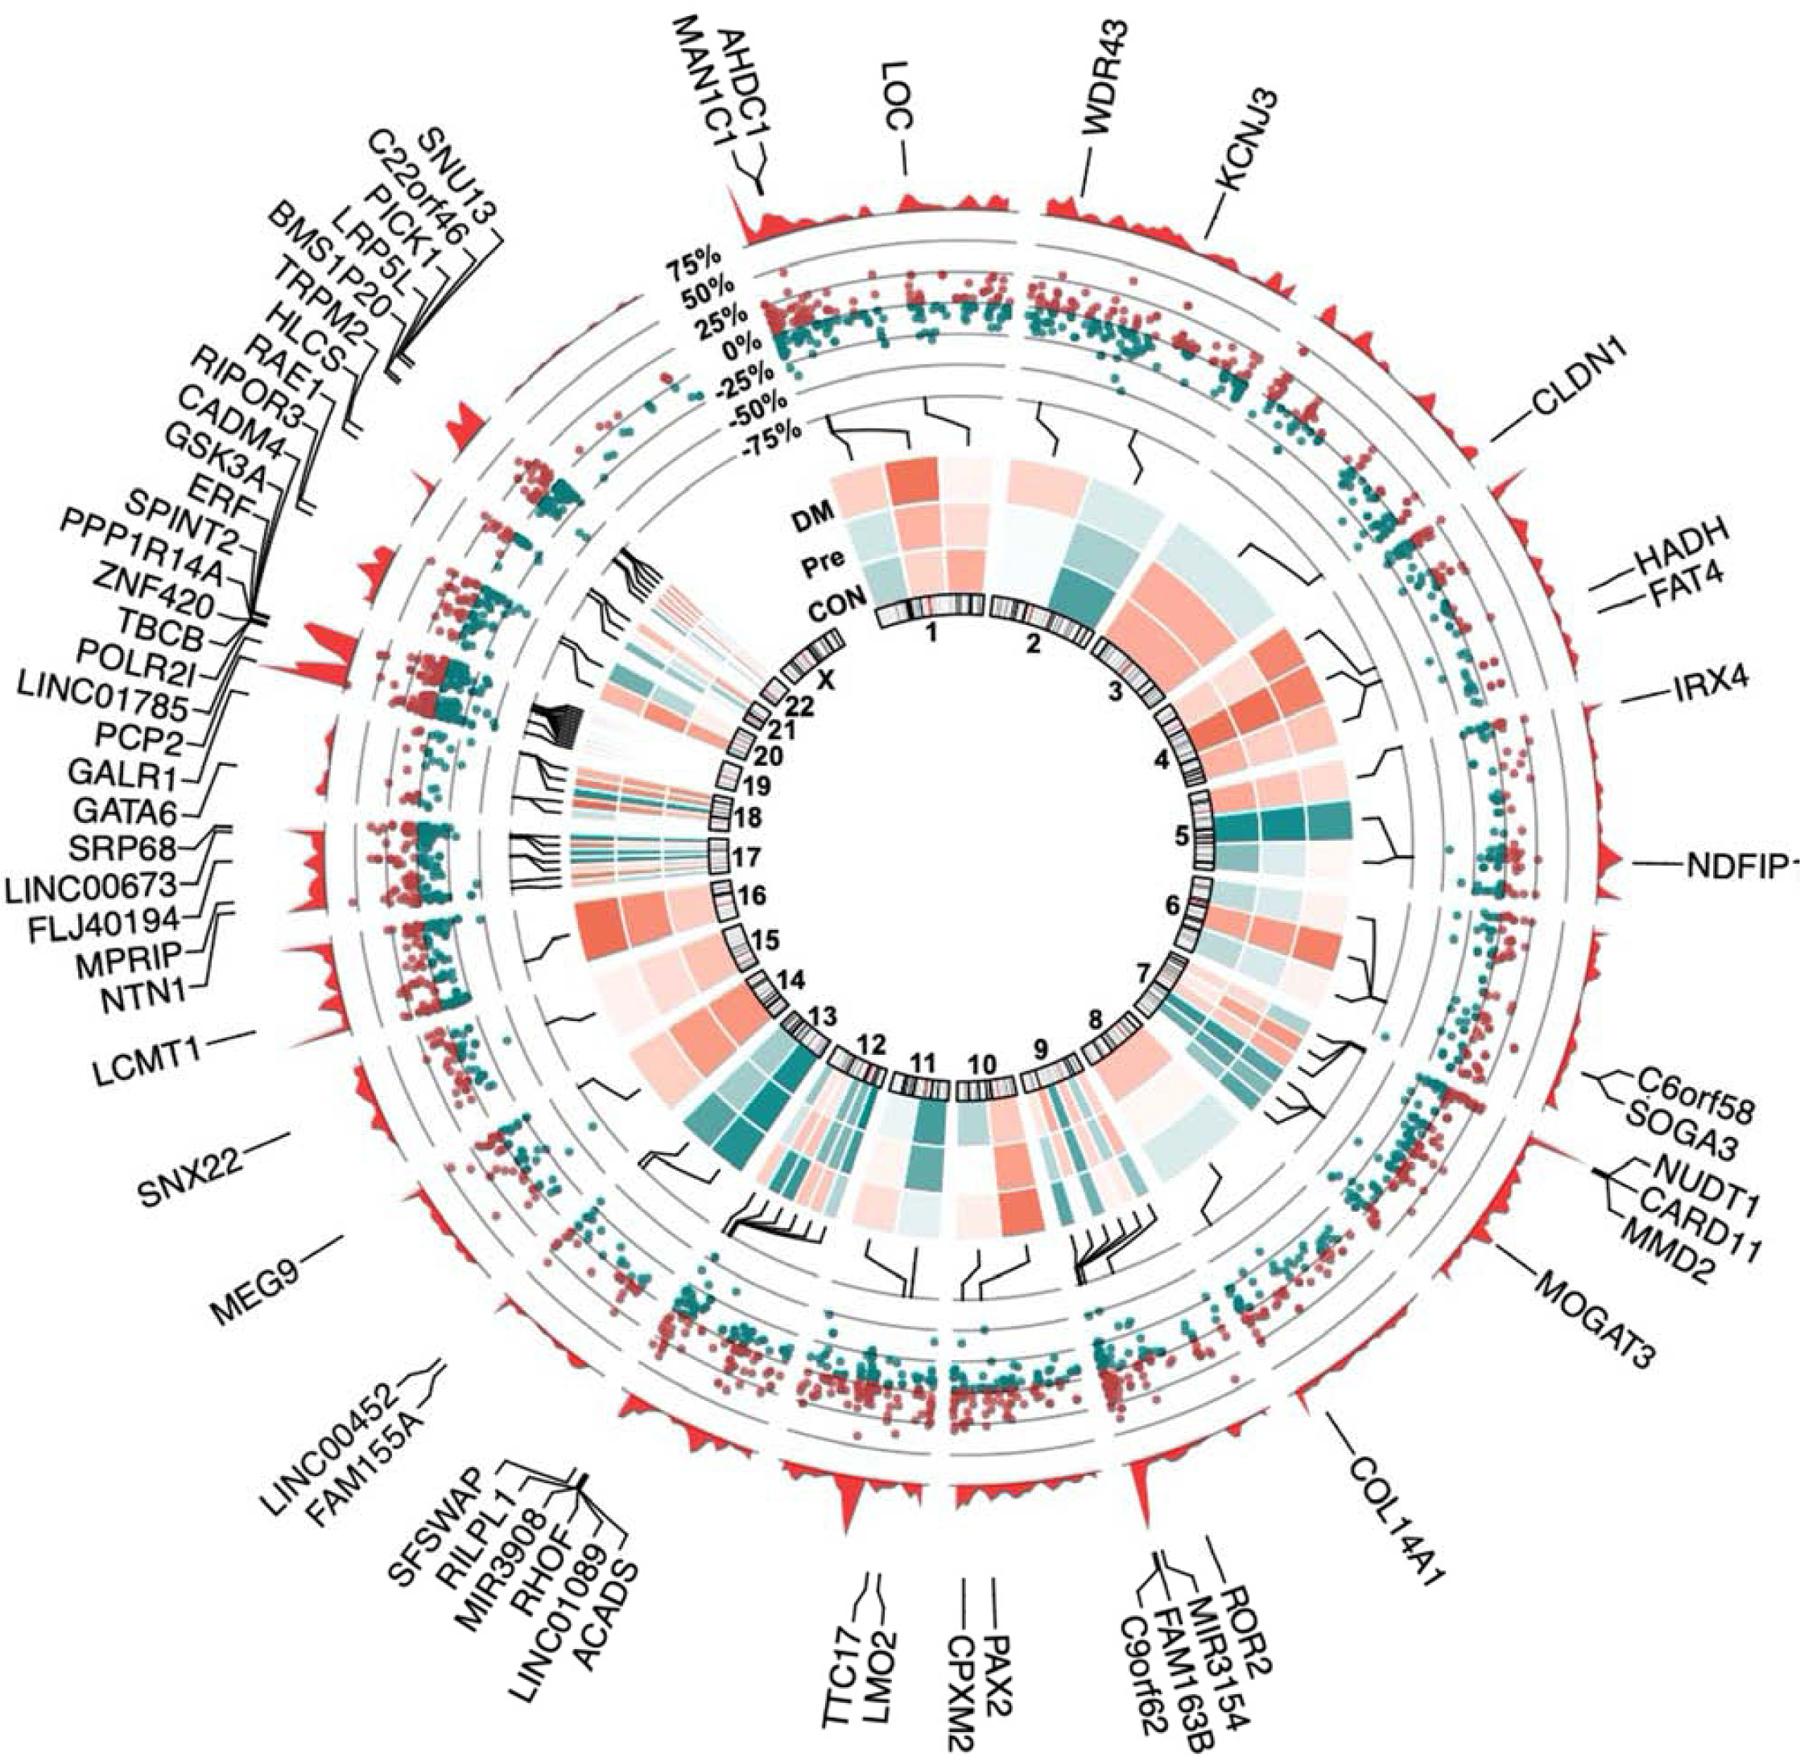
Figure 3: Epigenetic topography of glucose-responsive DMRs.

Circular genome plot illustrating the distribution of regional methylation, with methylation density plotted as the outermost data track (red). Genes possessing DMRs > 25% methylation under diabetic-range (250mg/dL) glucose were labeled, with the middle track representing percent methylation of increased (red) and decreased (green) DMRs (Q < 0.05, |Percent Methylation| > 25%). The innermost track depicts a normalized heatmap of average percent methylation for control, pre-diabetic, and diabetic-range glucose concentration (n = 2).
