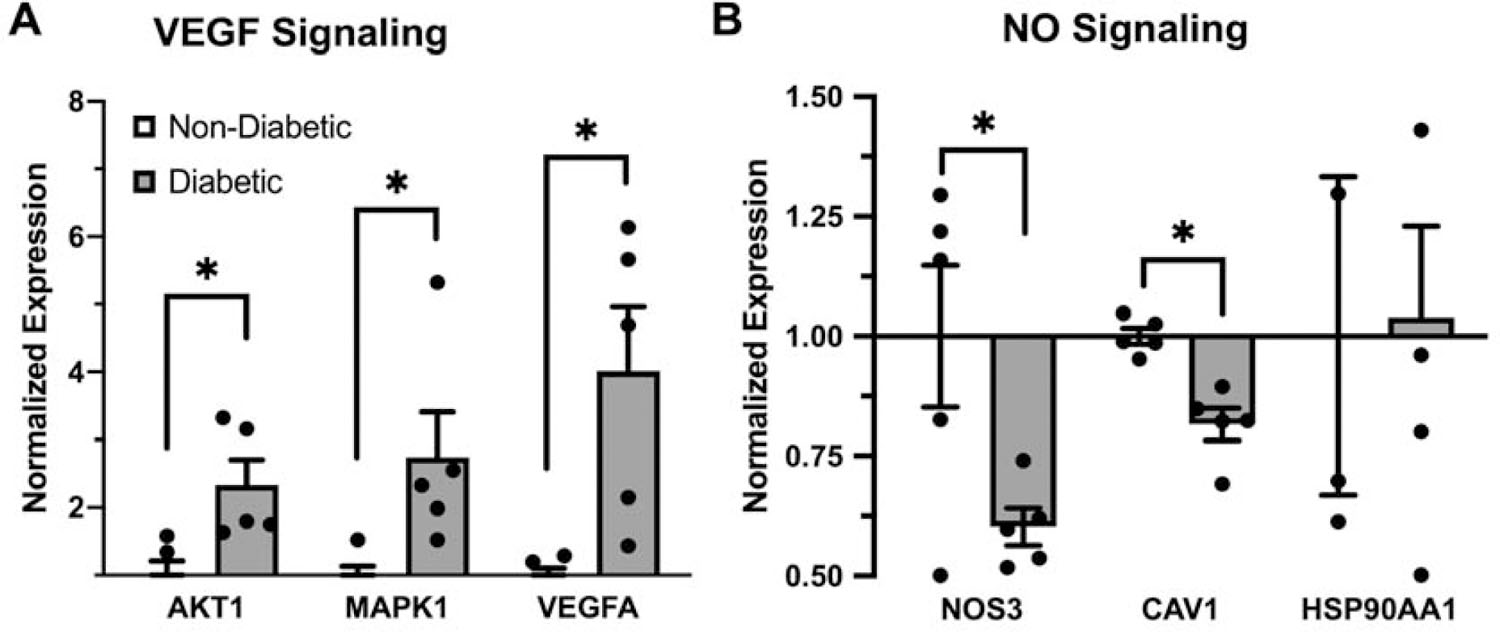
Figure 5: Differential expression of VEGF signaling and NO signaling intermediate genes.

Bar graph of normalized gene expression via array-based transcriptomic analysis of diabetic and non-diabetic subjects (n =5) endothelium of key intermediate genes involved in A. VEGF signaling and B. NO signaling cascades. Bars shown as mean ± standard error of the mean, with statistical significance assumed via student’s t-test.
