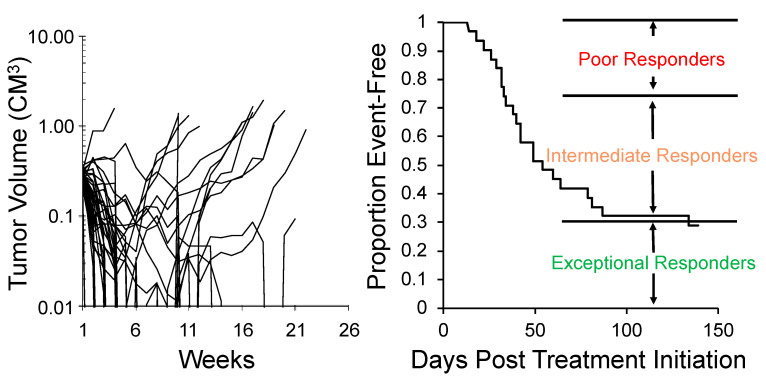
Figure 3.
SMT evaluation of trastuzumab-deruxtecan (DS-8201a). Left: Tumor volume response for 35 xenograft models treated with DS-8201a. Each curve represents the growth of an individual tumor. Right: Time to event is replotted as a Kaplan–Meier EFS Probability curve, allowing classification of tumors as poor-, intermediate- or exceptional-responders. Note 5 malignant rhabdoid tumor (MRT) models were maintained CR at week 25.

