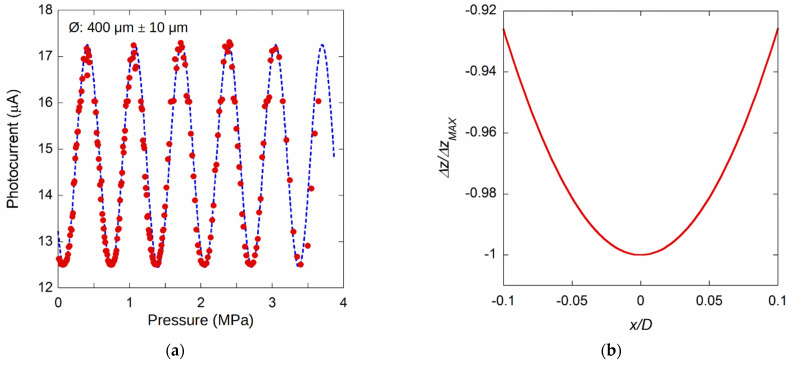
Figure 9.
(a) Photocurrent signal acquired for a membrane of about 400 µm diameter, for pressures up to 3.6 MPa. The dotted line represents the best fit of the experimental data according to Equation (2). (b) A simulation of the displacement per unit of pressure normalized to the maximum, as a function of the x position normalized to the membrane diameter D.

