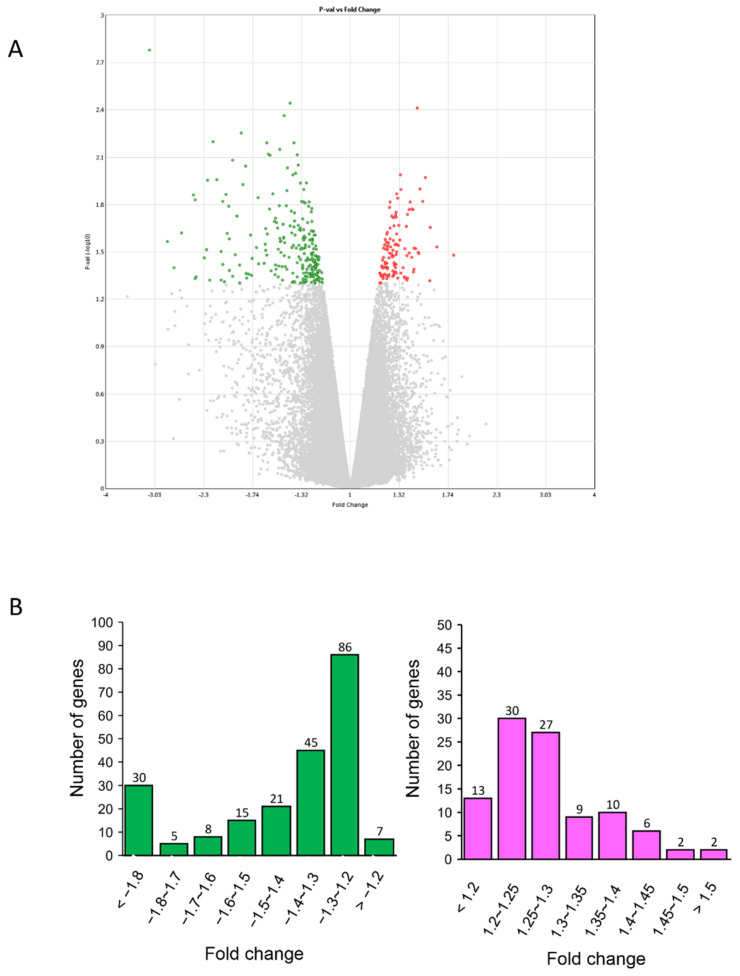
Figure 1.
Characterization of gene expression profiles in human amniotic epithelial cells (hAECs) with or without cyanidin-3-O-glucoside (Cy3G) (A) Volcano plot displaying differentially expressed genes (DEGs) between Cy3G-treated and untreated hAECs on day 7. The vertical axis corresponds to −log10 p-value of the ANOVA p-values, and the horizontal axis displays linear fold change. The red dots represent the upregulated genes, and the green dots represent the downregulated genes. (B) distribution of fold changes of downregulated genes (left) and upregulated genes (right) in Cy3G-treated hAECs.

