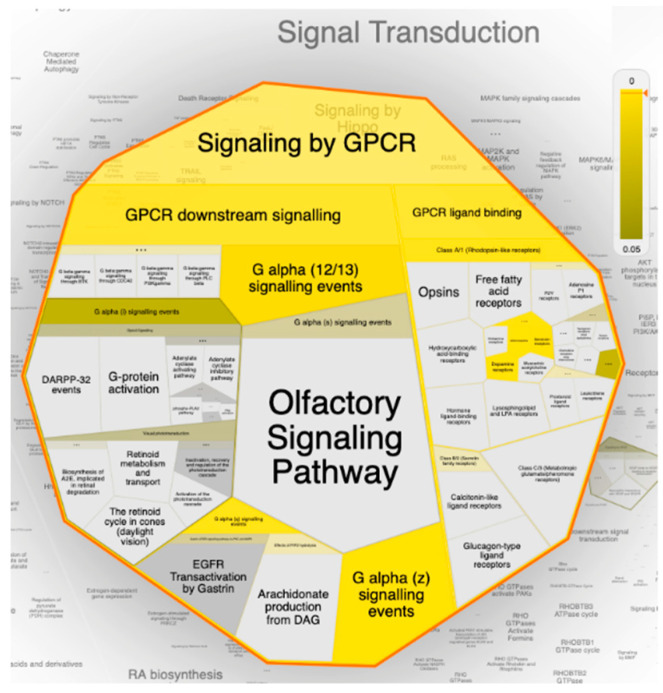
Figure 9.
The Voronoi treemap of the top pathway (signal transduction) influenced by the top 20 gene targets in response to erylosides B (226) in term of SARS-CoV-2 infection. The color highlights the over-representation of that pathway in the input dataset. Light grey signifies pathways that are not significantly over-represented.

