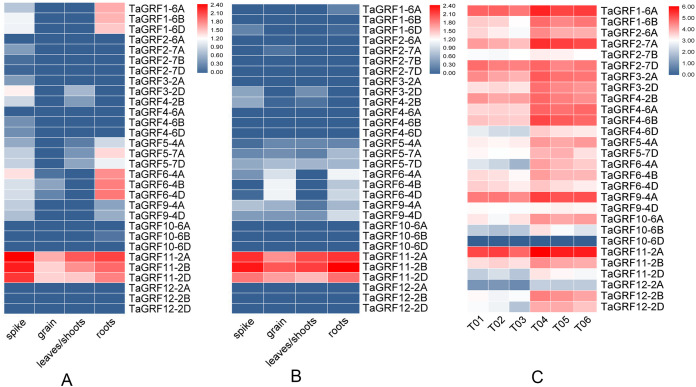
Figure 8. Expression profiles of the TaGRF genes in different wheat tissues.
(A) Heatmap of expression profiles of TaGRFs in Chinese Spring (CS). (B) Heatmap of expression profiles of TaGRFs in Azhurnaya. (C) Heatmap of TaGRF genes in tiller primordia of WT and dmc based on transcriptome data. Three biological replicates were set up in the mutant dmc (T01, T02 and T03) and WT (T04, T05 and T06), and each sample bulk of tiller primordia included more than 10 independent individuals. Note: Blue: Low expression level; Red: High expression level; The gene expression values present as log2-transformed normalized TPM values.

