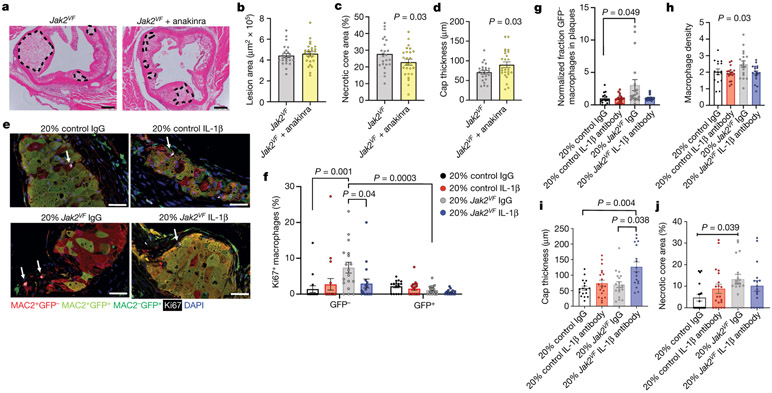
Fig. 4 ∣. Effects of anakinra or IL-1β antibodies on atherosclerotic plaque development.
a, Representative H&E images of aortic root lesions from mice with 100% Jak2VF bone marrow treated with anakinra. Dashed lines, necrotic core. Scale bar, 200 μm. b–d, Lesion area (b), percentage necrotic core area (c; n = 24 Jak2VF, n = 25 Jak2VF + anakinra mice), and cap thickness (d; n = 23 Jak2VF, n = 25 Jak2VF + anakinra mice). e, Representative immunofluorescence image of aortic roots stained for GFP (Jak2VF-negative cells), MAC2, Ki67 and DAPI. Arrows, Ki67+ nuclei. Scale bars, 25 μm. f, Percentage Ki67+ macrophages (n = 16 control, n = 18 Jak2VF mice). g, Fraction of macrophages in aortic roots normalized to fraction in blood monocytes (n = 16 control, n = 19 Jak2VF mice). h–j, Quantification of aortic root lesion macrophage density (h), cap thickness (i), and necrotic core area (j) (n = 16 control, n = 20 Jak2VF mice). Mean ± s.e.m.; two-tailed t-test (b–d); one-way ANOVA with Tukey’s post hoc analysis (h); two-way ANOVA with Tukey’s post hoc analysis (f); Kruskal–Wallis two-tailed test with Dunn’s comparison (g, i, j).

