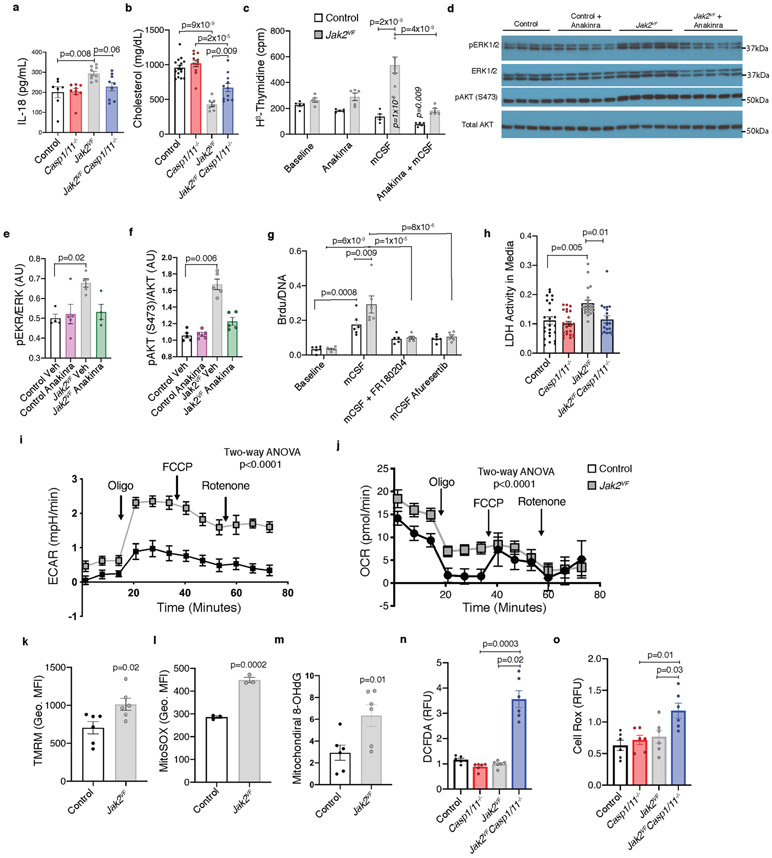
Extended Data Fig. 5 ∣. IL-1β promotes increased ERK/AKT-driven proliferation of Jak2VF macrophages associated with increased glycolytic metabolism and mitochondrial ROS generation.
a, b, Quantification of serum IL-18 (a; n = 7 control, n = 9 Casp1/11−/−, n = 9 Jak2VF, n = 9 Casp1/11−/−Jak2VF mice) and cholesterol (b; n = 16 control, n = 11 Casp1/11−/−, n = 7 Jak2VF, n = 11 Casp1/11−/−Jak2VF mice) following 12-week WTD. c, Macrophage proliferation marked by 3H-thymidine incorporation into BMDMs during 16-h incubations (n = 4 biological replicates, replicated twice). d, Representative immunoblot analysis of BMDMs co-incubated with anakinra. e, f, Densitometric quantification of pERK1/2 (e; n = 4 control, n = 5 control + anakinra, n = 5 Jak2VF, n = 4 Jak2VF + anakinra; biological replicates from three mice pooled, representative of two experiments) and pAKT (f; n = 5 biological replicates from three mice pooled, representative of two experiments). g, Incorporation of BrdU into BMDMs co-incubated for 16 h with 100 ng ml−1 M-CSF and the indicated inhibitors (n = 6 biological replicates from three mice pooled, n = 5 M-CSF + FR180204). h, LDH release from non-stimulated BMDMs following 7-day culture (n = 24 control, n = 24 Casp1/11−/−, n = 22 Jak2VF, n = 19 Jak2VFCasp1/11−/− biological replicates from three mice repeated four times). i,j, Glycolysis rate indicated by the extracellular acidification rate (ECAR) (i) and mitochondrial respiration marked by oxygen consumption rate (OCR) (j; n = 15 control, n = 18 Jak2VF biological replicates repeated twice). k, Mitochondrial potential in CD11b+ splenocytes measured by tetramethylrhodamine, methyl ester, perchlorate (TMRM) geometric mean fluorescence intensity (geo. MFI) (n = 6 mice). l, MitoSOX geo. MFI in BMDMs (n = 3 mice). m, Quantification of mitochondrial localized 8-OHdG in BMDMs (n = 6 mice). n, o, Total cellular ROS in BMDMs marked by relative fluorescence units (RFU) of DCFDA (n) and Cell ROX (o; n = 6 biological replicates from three mice pooled). Mean ± s.e.m.; one-way ANOVA followed by Tukey’s post hoc test (a, b, e, o), Kruskal–Wallis two-tailed test with Dunn’s comparison (f, h, n), two-way ANOVA followed by Bonferroni’s multiple comparison post hoc test (c, g, i, j), two-tailed t-test (k–m).

