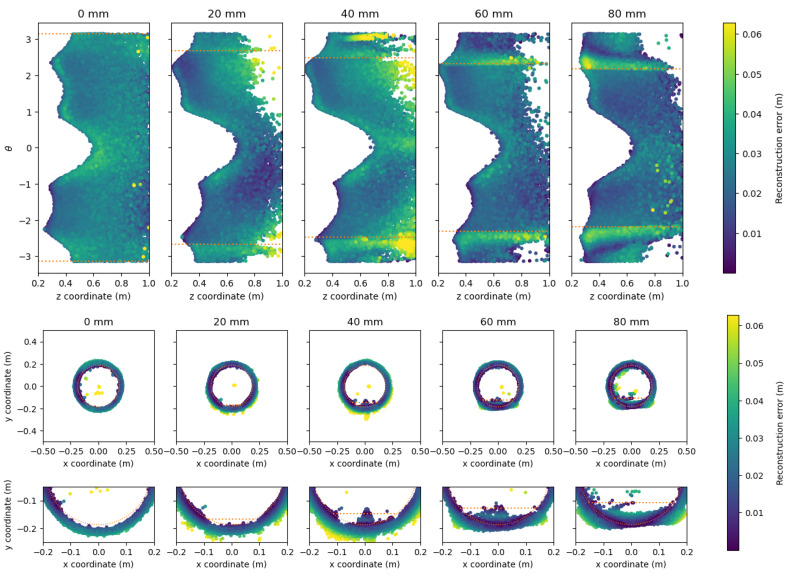
Figure 17.
Reconstructed point cloud for the water level experiments by the pico flexx camera. The water level and pipe geometry is indicated with the orange line. The points are color-coded according to the cloud-to-mesh distance to the reference pipe. (Top) unfolded view of the reconstructed pipe. The water level is indicated with an orange dotted line. (Middle) View from the XY-plane of the reconstructed pipe. (Bottom) Zoomed in view of the XY-plane of the reconstructed pipe.

