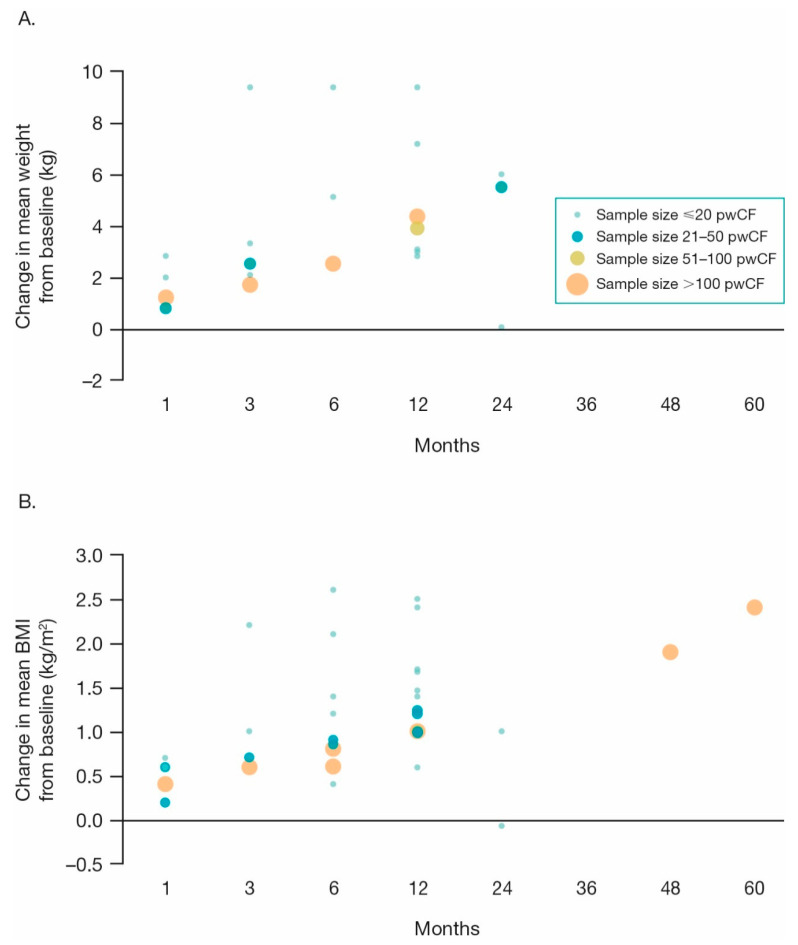
Figure 4.
Change in mean weight (A); 10 studies) and mean BMI (B); 17 studies) with ivacaftor treatment [30,34,37,40,42,44,45,46,49,51,53,58,66,69,71,72,73,75,78,83,86,92,96,98,99,101]. Note: Figure only includes studies reporting absolute change from baseline within the ivacaftor-treated cohort in BMI and/or weight at 1, 3, 6, 12, 24, 36, 48, and/or 60 month time points following ivacaftor treatment. BMI: body mass index; pwCF: people with cystic fibrosis.

