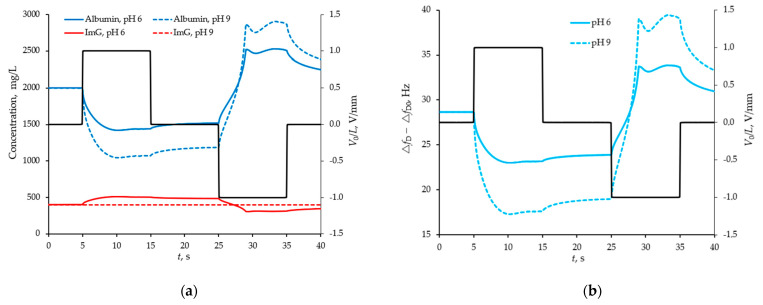
Figure 4.
Average concentration of proteins (shown by red and blue curves) trapped in the space between the barriers of the sensor with the structured surface at two different pH values (a) and the difference response from two sensors (with smooth and structured surfaces) in the form of a shift (shown by blue curves) of their resonance frequencies (b) by manipulation of the model buffer solution with proteins by external pulsed field (indicated by a black broken line).

