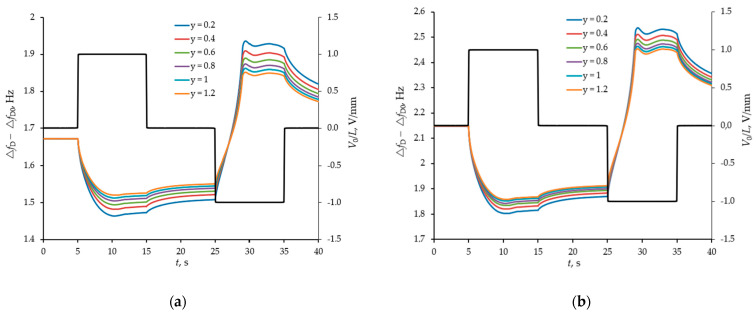
Figure 7.
The difference response from two sensors (with smooth and structured surfaces) in the form of a shift of their resonance frequencies to manipulation of a model buffer solution with proteins by an external pulsed field at different ratios of oligomeric forms of uromodulin (y = [T&HE (28)]/[T&HE ( 7)], [T&HE (28)] + [T&HE (7)] = 120 mg/L) for a normal albumin level of 20 mg/L (a) and for its 3-fold increase (b). Frequency shifts (left axes) are shown with coloured curves, and pulse actions (right axes) are shown with a black broken line.

