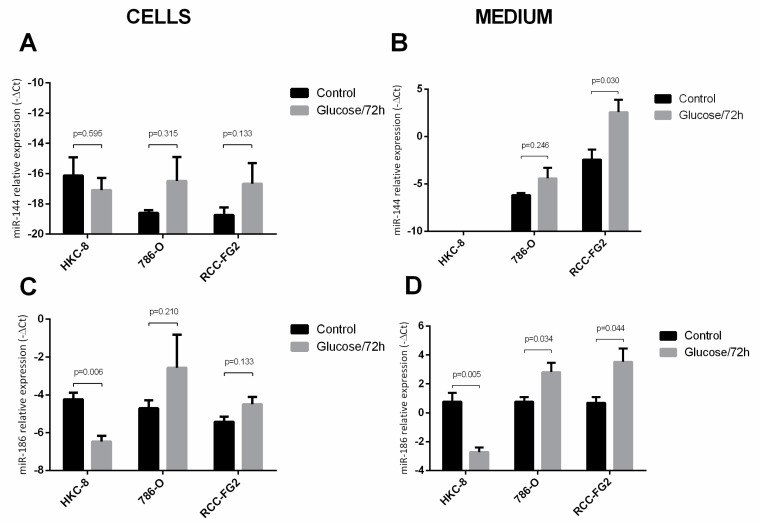
Figure 3.
Variation of the intracellular and extracellular levels of hsa-miR-144-5p and hsa-miR-186-3p in HKC-8, 786-O and RCC-FG2 after a 72 h stimulus with glucose. (A) hsa-miR-144-5p levels in HKC-8, 786-O and RCC-FG2 cell lines with and without the glucose stimulus; (B) hsa-miR-144-5p levels in HKC-8, 786-O and RCC-FG2 culture medium with and without glucose stimulus; (C) hsa-miR-186-3p levels in HKC-8, 786-O and RCC-FG2 cell lines with and without the glucose stimulus; (D) hsa-miR-144-5p levels in HKC-8, 786-O and RCC-FG2 culture medium with and without glucose stimulus; The bars represent the -ΔCT of miRNAs expression normalized to RNU44. (mean ± SE).

