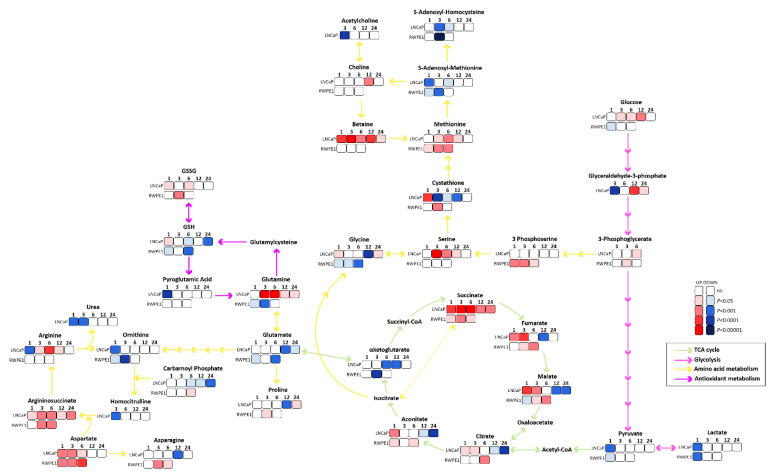
Figure 2.
Metabolite alterations upon succinate stimulation. Metabolomics pathway network map of main pathways affected by succinate, TCA cycle (green arrows), glycolysis (pink arrows), amino acids metabolism (yellow arrows) and antioxidant metabolism (purple arrows) pathways are shown. Significantly increased metabolites are in red scale and significantly decreased are in blue scale. The darker the color, the higher the statistical significance, white squares represent no statistical difference to control. (N ≥ 4).

