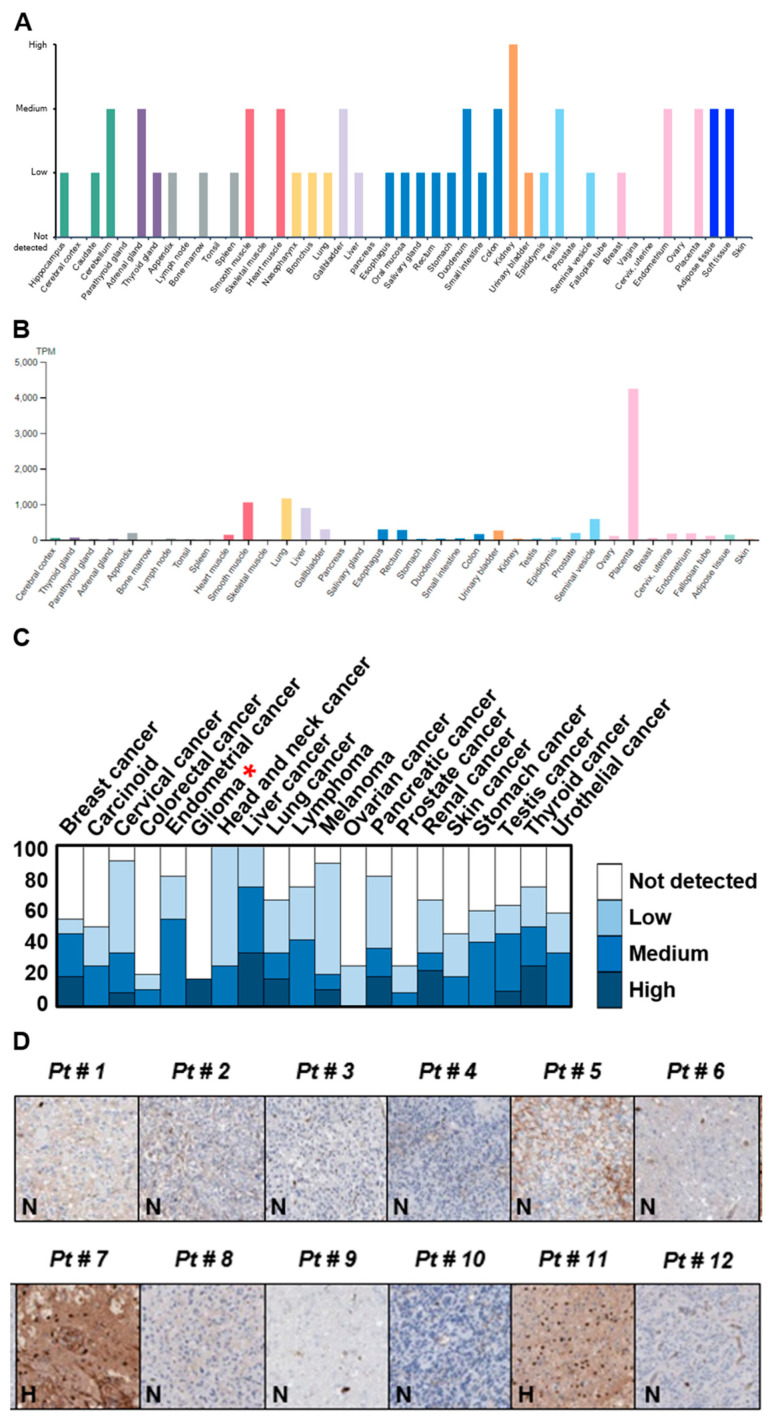
Figure 1.
Fibronectin (FN) displays low-to-medium levels in distinct tissues and organs but exhibits either no or high expression in gliomas. (A) Protein and (B) RNA levels of FN in different tissues and organs obtained from the Human Protein Atlas database (https://www.proteinatlas.org/, accessed on 1 November 2017) mining. (C) Statistical pattern of FN expression in distinct cancer types by immunohistochemical (IHC) staining acquired from the Human Protein Atlas database mining. (D) Expression of FN in 12 glioma specimens by IHC staining provided by the Human Protein Atlas database mining. Red * indicates the statistical expression pattern of FN in glioma tumors.

